
Address: ul. Orla 171, 30-244 Kraków
Phone: 12 6238 620
For media & schools: press@oa.uj.edu.pl


Sky above: OAUJ, Kraków (live)
Be inspiration. Create the future.

S. Markowski - W obserwatorium
Address: ul. Orla 171, 30-244 Kraków
Phone: 12 6238 620
For media & schools: press@oa.uj.edu.pl
Sky above: OAUJ, Kraków (live)
Be inspiration. Create the future.
S. Markowski - W obserwatorium
Astronomers from the Jagiellonian University Astronomical Observatory, with the help of dedicated and archival data from the European radio interferometer LOFAR, report a group of active galaxies with unexpected, extensive radio structures. Their analysis may provide new insight into past activity cycles of supermassive black holes residing at their centres.
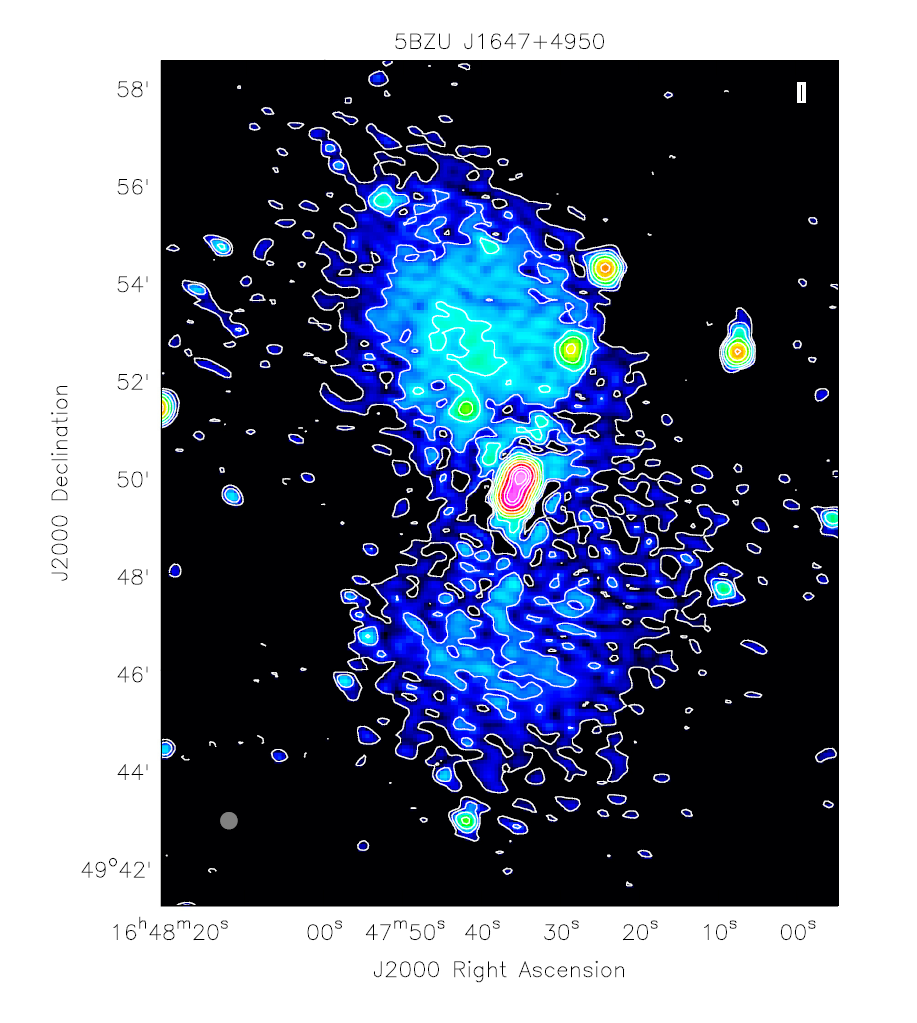
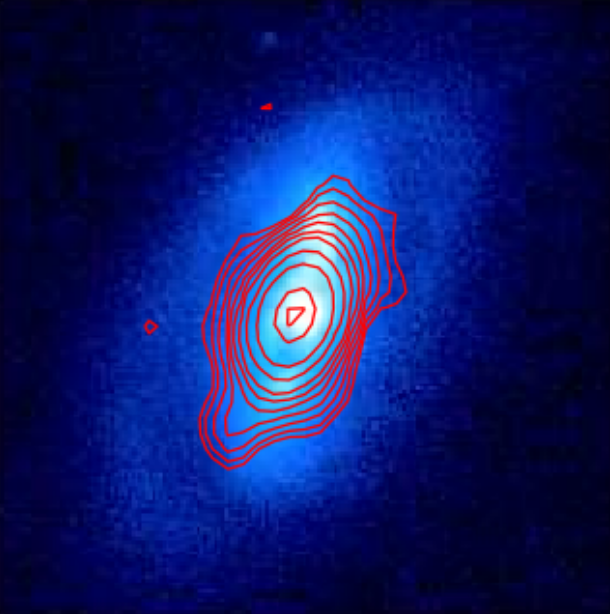
Figure 1: Illustration 1: Radio image of blazar catalogued as 5BZU J1647+4950. The observations are from the LOFAR array. Thanks to the very high sensitivity of the instrument, a huge radio structure can be seen here, resembling two jagged lobes, measuring about 3 million light years (equivalent to about 2.5 x 10¹⁹ km)! At the heart of the object resides a supermassive black hole, and the emission associated with its consumption of infalling matter is evident, among others, in the form of a bent radio jet, visible as an elongated, intense structure at the very centre of the map. In this case, the jet is pointing in our direction. The grey circle in the lower left corner of the map indicates the resolving power of the observation. Credit: The Authors
Active galaxies (ang. Active Galactic Nuclei; AGNs) are a specific group of sources that we can observe in the sky. They emit huge amounts of energy as their inner 'engines' are supermassive black holes residing in their centres (with masses in the order of millions or even billions of solar masses), powered by the matter accreting onto them. Sometimes, jets are also formed near the poles of the black holes – dense flows of matter and radiation that spread far beyond the galaxy itself, forming huge and radio-luminous lobes. Such structures are usually observed as so-called radio galaxies, whose jets are visible in the plane of the sky.
A special class of active galaxies are blazars, in which one of the jets is directed towards the Earth. For this reason, they are most often visible to us as very compact radio sources. However, thanks to modern telescopes observing the sky at long wavelengths, it is possible to observe blazars that are different from this description as they possess very extensive structures. Such objects have been observed with the European LOw Frequency ARray (LOFAR) interferometer at wavelengths of roughly two metres. They have very strong and compact radio centres, jets of tens of thousands of light years in length light years, and extended structures that in extreme cases reach millions of light years in length.
Pictured in Illustration 1 is blazar 5BZU J1647+4950 along with its massive structure, discovered by the authors of the discussed work. The panel shows the entire object, exhibiting radio structure resembling two radio lobes measuring about 3 million light years in the projection on the sky. This is almost as much as the entire distance separating the Milky Way from the Andromeda Galaxy!
The origin of such structures can be explained by the specific activity cycle of the host object. If the galaxy collides with another galaxy during its existence, and at the same time its supermassive black hole collides with another supermassive black hole, a change in the direction of the jets' propagation may occur, and/or their multiple emission. The former activity of the galaxy will leave a trace on the sky in the form of large, faint and old radio structures that lies in a different direction to the present AGN emission (i.e. radio jets).
Jets can also be precessing, forming S-shaped structures. An example of such blazar is visible on Illustration 2. In this case, we can observe two bent (precessing) jets, forming extensive but much fainter radio lobes.
The aim of further research will be to estimate the exact physical parameters of these structures, such as the strength of their magnetic field and their age.
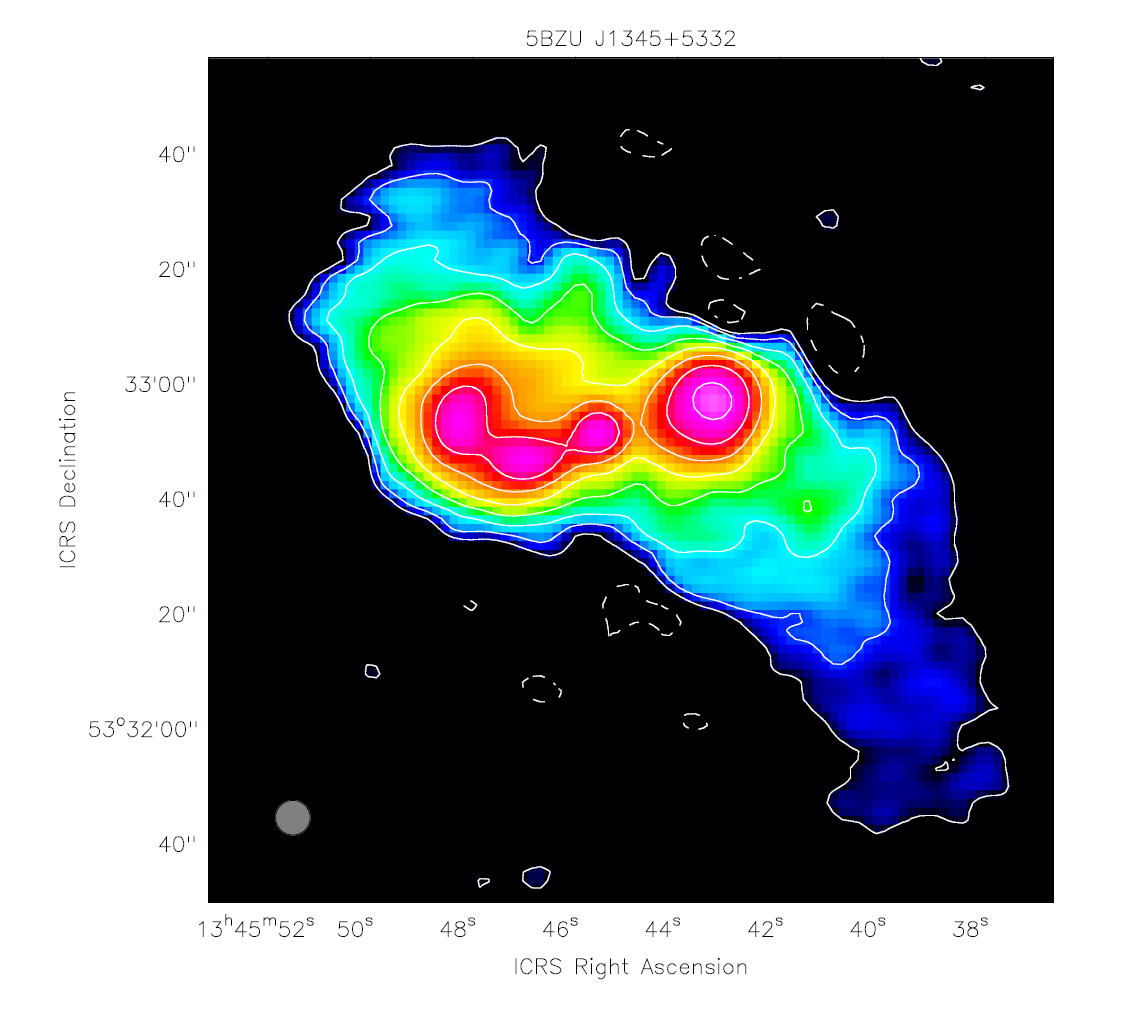
Illustration 2: Radio image of blazar 5BZU J1345+5332 observed with the LOFAR telescopes network. At the very centre of this object lies a supermassive black hole. It is most likely that the two opposing jets are undergoing precession, and so the extensive radio emission takes the form of the S-shaped letter. The grey circle in the lower left corner of the map indicates the resolving power of the observation. Credit: The Authors.
Contact
|
Urszula Pajdosz-Śmierciak Astronomical Observatory |
Original publication
Pajdosz-Śmierciak U., Śmierciak B. i Jamrozy M., Possible jet reorientation in low-frequency radio structures of blazars, MNRAS, 512, 2122 (2022).Blazars are a subclass of active galactic nuclei with relativistic jet facing the earth. These are variable in luminosity and spectra. Markarian 421 is a blazar that is highly luminous and variable, a high energy synchrotron peaked blazar with a featureless non-thermal spectra. It is one of the closest blazar with a redshift of 0.03 which gives approximately 134 Mpc. It is a highly energetic source which emits in the entire observable electromagnetic spectrum; the first extragalactic source that was observed to emit in TeV energy range in 1992. The source is variable at very short timescales of minutes to few hours, that is it displays intraday variability (IDV). The IDV phenomenon is one of the most puzzling one in blazars and yet to be completely understood. This is speculated to have a relation with the close surrounding of the supermassive black hole.
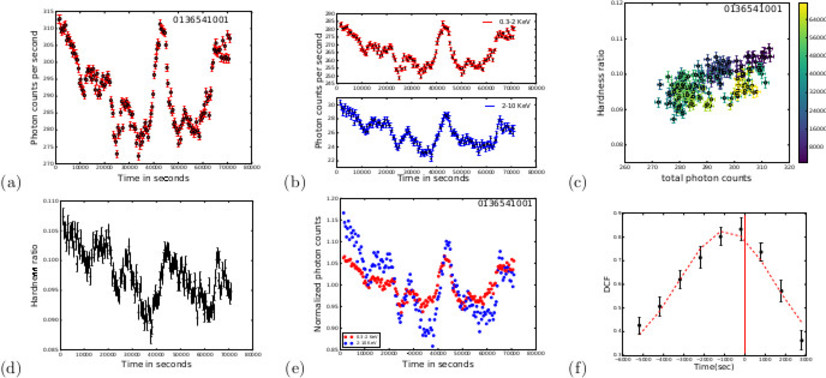
Figure 1: Obs. ID 0136541001 — (a) light curve in the total energy range (0.3-10.0 keV); (b) light curves in hard and soft energy bands; (c) hardness ratio vs. intensity (HR-I) diagram; (d) HR vs. time; (e) normalized light curves in the hard and the soft energy bands (points without error bars for the picture clarity); (f) a discrete correlation function (DCF). In panel (c), the observational time (in seconds) is coded with a colour — dark blue for the beginning and yellow for the end of observation.
A group of researchers under the Indo-Polish collaboration between the Jagiellonian University, IFJ-PAN and ARIES, India did a detailed work on the variability of Markarian 421 in X-ray energy range of 0.2 keV to 10.0 keV using the XMM-Newton X-ray data. Markarian 421 is one of the most widely monitored blazar and the group used this to understand the IDV in X-rays using this source. In this work as well, Mrk 421 is used to understand the complex behaviour of a blazar in intraday variability timescales in X-ray energy band.
To understand this better, work was done to analyse the extent of flux variability. Also, the method of hardness ratio was used to under the spectral variability. This method is a model independent method. The correlation between the flux and spectral variability was evaluated. For the hardness ratio, the analysis was done using the energy ranges 0.2-2.0 keV and 2.0-10.0 keV, which are referred to as soft and hard energy band, respectively.
In the large set of observations from XMM-Newton EPIC-pn instrument that have been used for this work, 96% duty cycle was observed but variability up to some extent was observed in all observations. The variability in the hard band was from 1 to 2.5 times higher than the variability in soft band. The minimum variability timescale was found to be diverse from ~1 ks to 10.6 ks. This is not randomly distributed but has a trend over a period of 17 years. This indicates regular changes in physical conditions in the emission processes. From the discrete correlation function analysis, there was not any constant pattern of occurrence of lag in one band over the other. In most cases there was zero lag in the entire observations but from the normalized light curves it could be seen that there was either positive or negative lags occurring around individual flares. Also observations with some amount of lag did not show lag in the normalized light curves during individual observations. Discrete correlation function maybe a good method for testing individual flares, but not the entire observation of highly variable sources like Mrk 421. The hard band showed to be more variable than the soft band, with the common harder when brighter trend in all observations.
Also in the hardness ratio-intensity plots, there were loops forming both clockwise and anti-clockwise with respect to time. The interesting case is of one observation that was taken on December 1, 2002 showed a change in the direction of loop during the flaring state. Although previous works explain it by differing acceleration and cooling timescales, here this is said to be the cause of the complex relativistic magnetic field reconnection regions and the relativistic turbulence inside the jet volume that is modulated by the fluctuating jet density. Also, in the set of observations here, the observations forming clockwise loop displayed positive time lag while the ones with an anti-clockwise loop showed a negative time lag. Another notable feature observed was the dependence of lag on variability. The negative lag was large in low variable observations while positive lag was large in highly variable observations.
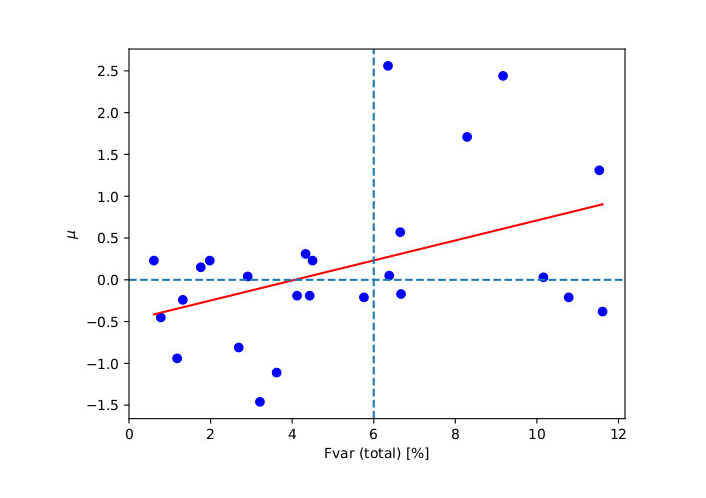 Figure 2. Fractional variability Fvar versus the parameters of the Gaussian fits of the DCF maximum: the time lag μ. Red line represents linear fit to the presented distributions, in without considering the two “non-variable” outliers with lowest Fvar. The dashed lines in the panel are for a reference to show the dependency of lag on variability. Credit: The Authors.
Shocks require longer time for acceleration which is not observed in the observations of Mrk 421 so this may not be the plausible explanation for the synchrotron emission in blazars in X-ray energy band. It maybe contributes to the other acceleration and emission processes in the medium, but no signs of it are observed in the medium. Some observations show soft lag which is contrary to the contribution of shocks to the synchrotron emission. The contribution of relativistic magneto-hydrodynamic turbulence appears to be more apt to explain the X-ray emission. The magnetic reconnection may also seem like a good explanation but some symmetry was observed in individual flares because of which this maybe ruled out unless there is a contribution of some external systematic processes. This maybe also that there is contribution of multiple magnetic reconnection processes with each operating on timescales shorter than the flares observed.
To sum up, it is worth considering these intraday variability features as well while modelling the emission processes of blazars. Immense care must be taken for the modelling of blazars because these consider large number of free parameters. All models should be verified with multi wavelength observations.
Contact
|
Angel Priyana Noel Astronomical Observatory |
Original publication
Angel Priyana Noel et al., X-Ray Intraday Variability of the TeV Blazar Markarian 421 with XMM-Newton, The Astrophysical Journal Supplement Series, 262, 1 (2022).A team of researchers lead by Maria Dainotti, Assistant Professor at the National Astronomical Observatory of Japan (NAOJ), has achieved a tight correlation between the redshift values predicted by a machine learning algorithm and the actual observed redshifts of powerful galaxies called Active Galactic Nuclei (AGNs). This is the first time that redshifts for AGNs observed by the Fermi Gamma-Ray Space telescope have been estimated using machine learning algorithms, and their results offer a fantastic avenue where the unknown redshifts of many AGNs can be reliably determined.

AGNs are some of the most powerful objects in the Universe. Their galactic centers are extremely active regions, emitting huge amounts of radiation. Thus, they are visible across vast distances at different redshifts. However, measuring the redshifts of these galaxies is notoriously difficult as they require extensive spectroscopic observations. This is a difficult and time-consuming task. The problem is even more pronounced for galaxies that are observed primarily in the gamma-ray regime of the electromagnetic spectrum. For example, with the Fermi Gamma-Ray Space Telescope, the state-of-art in gamma-ray observations, only 50% of AGNs have spectroscopic redshift, out of more than 3000 that have been observed so far. This is a significant hurdle for researchers trying to use these AGNs for studying the Universe. A galaxy’s redshift tell us how far away that galaxy is and are hence fundamental for understanding the Universe and the galaxies in it. Thus, there is a requirement for a technique that can estimate the redshift of these galaxies quickly and accurately, without the need for lengthy spectroscopic measurements.
To achieve this goal, the researcher elected to use powerful machine learning algorithms, trained on AGNs from Fermi’s Fourth LAT Catalog (4LAC) that already have redshift measurements. The algorithms learn the underlying correlations between the redshift of a galaxy and its measured gamma-ray properties. Based on these correlations the models try to predict the redshift. As these properties are measured directly by the Fermi telescope, they are easy to obtain. Establishing a strong correlation between them and a galaxy’s redshift can give fast and accurate predictions.
However, an almost limitless choice exists as to which machine learning model should be chosen. Each model has its own advantages and disadvantages, making them more or less suitable for a particular data set. Models that work best for other astronomical data sets may not be effective in the case of Fermi AGNs.
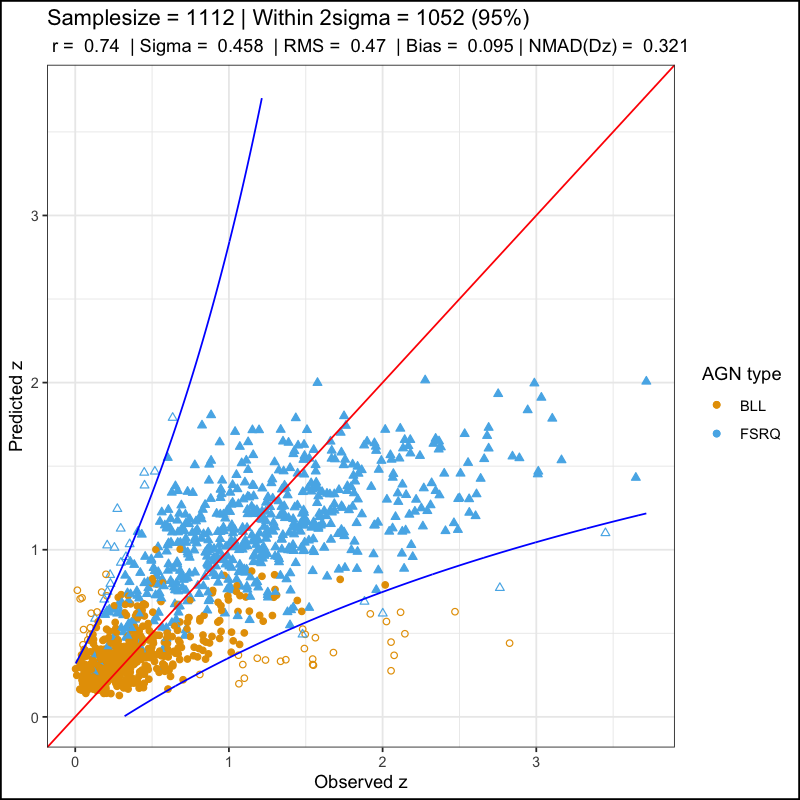
To resolve this puzzle and use the best possible models, the team decided to use a technique called SuperLearner. The SuperLearner belongs to a category of machine learning algorithms called ensemble learning. This means it can combine multiple machine learning models to generate a single model that performs better than any single model. In this way, SuperLearner leverages the strengths and minimizes the weaknesses of multiple machine learning models. This way, the machine learning models best suited for the Fermi data can be chosen and give the best possible results. Armed with this powerful technique, researchers trained six machine learning models on the Fermi data, which were combined inside SuperLearner to produce redshift estimates that have a 74% correlation with the actual observed redshift. This is the highest redshift correlation that has been achieved yet for Fermi AGNs, making this a very important achievement.
The team did not stop there. Using this powerful machine learning model, they predicted the redshift for 305 AGNs from the 4LAC catalog that previously did not have redshift measurements. And as a test of the model’s real work perform, estimated the redshift of 47 AGNs that had not been used for training the model. Here also they achieved a 73% correlation.
These pioneering work have shown that fast and accurate redshift estimates of AGNs are possible using their observed gamma-ray properties. They also show that the missing values present in the 4LAC and other similar catalogs can be imputed so that nearly complete observations can also be used in the training of such models. As of this writing, the three articles published by the group are the only ones exploring the redshift estimation of gamma-ray loud AGNs of the 4LAC.
Contact
|
Aditya Narendra Astronomical Observatory |
Original publication
These results appeared first is Dainotti et al., Predicting the Redshift of γ-Ray-loud AGNs Using Supervised Machine Learning, the Astrophysical Journal, 2021, followed by Narendra et al., Predicting the Redshift of Gamma-Ray Loud AGNs Using Supervised Machine Learning. II (the Astrophysical Journal 2022) and finally in Gibson et al., Using Multivariate Imputation by Chained Equations to Predict Redshifts of Active Galactic Nuclei, in Frontiers in Astronomy and Space Sciences on March 4, 2022.In the 1980s when Infrared Astronomical Satellite (IRAS) was scanning the sky, it came across a few bright sources in the Infrared wavelength, which were too faint to be detected in previous optical surveys. These galaxies were classified as Infrared galaxies. Luminous Infrared galaxies (LIRGs), as the name suggests, are characterized by a prodigious amount of emission at infrared (IR) wavebands (LIR > 1011 L☉). The bulk infrared emission in these galaxies is due to warm dust heated by active galactic nuclei, starbursts, or both. These galaxies hence provide a unique laboratory to do a comprehensive study of star formation and AGN activity.
The spectral energy distribution (SED), although dominated by infrared emission, stretches from X-ray to radio wavebands. It is the outcome of the complex physical interplay between their main baryonic components such as stars of all ages and their remnants; molecular, atomic, and ionized gas; dust; and supermassive black holes. The panchromatic SED of a galaxy contains the imprint of these baryonic processes that drive its formation and evolution along cosmic times. Comparing the SEDs at different emission wavebands provide key insight into the origin and nature of emission and the factors setting their energy balance.
With this motivation, we performed a SED modelling of radio-only and far-ultraviolet (FUV) to radio bands of a sample of 11 local LIRGs, including our new measurements at 325 and 610 MHz frequencies using the Giant Metrewave Radio Telescope. In our work, we report the results of detailed radio SED modelling covering ~80 MHz to ~15 GHz and UV-radio SED modelling conducted using Code Investigating GALaxy Emission (CIGALE).
Integrated radio SEDs are modelled with physically motivated scenarios in which the radio continuum originates from either single or two emission regions characterized by the same or different populations of cosmic-ray electrons and optical depths. Hence, radio-only SED modelling show complex shapes with multiple turnovers for some galaxies (Fig. 1) instead of the simple power-law.
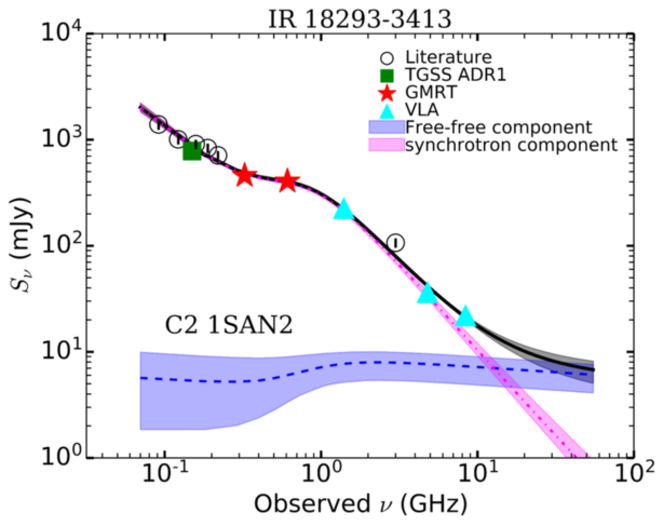
Figure 1. Radio SED of galaxy IR18293-3413. Credit: The Authors.
One of the primary goals of this paper is to compare the astrophysical properties resulting from SED modelling at radio-only and FUV to radio bands. The shapes of SEDs reflect the radiation laws and their parameters (such as power-law energy index or emissivity) and the physical processes affecting those parameters, such as cooling or heating mechanisms in the medium. Moreover, integrated SEDs provide total energetics from different frequency regimes, and comparing those offers key information on the nature of emission and general factors that determine their energy balance. In this study, we performed SED modelling where model parameters are estimated using state-of-the-art Bayesian (radio-only) and Bayesian-like (CIGALE modelling) inference techniques. The radio-only SED modelling allowed us to decompose non-thermal and thermal radio components while the CIGALE modelling allowed us to fit complex star formation history models, i.e., delayed star formation with an exponential burst (in our case), enabling us to estimate SFRIR at different time.
A striking result is that we obtain a much better correspondence of radio emission (total and synchrotron) with the young stellar population of about 10 Myr than with the older population (Fig. 2). This is probably due to the relatively short lifetime of the synchrotron cosmic-ray electrons at the 1.4 GHz frequency. At this frequency, in a magnetic field of about 50 μG, the synchrotron lifetime is ~3.3x10⁵ years. Therefore, synchrotron emission may be an effective indicator of recent star formation rates in galaxies. Our analysis strengthens that 1.4 GHz radio SFR measurements can be used as a diagnostic tool for high-z galaxies.
Contact
|
Subhrata Dey Astronomical Observatory Dr. hab Arti Goyal Astronomical Observatory |
Original publication
Subhrata Dey, Arti Goyal, Katarzyna Małek, Timothy J. Galvin, Nicholas Seymour, Tanio Díaz Santos, Julia Piotrowska, Vassilis Charmandaris, Low frequency radio continuum imaging and SED modeling of 11 LIRGs: radio-only and FUV to radio bands. The article has been accepted for publication in ApJ.A new method to exploit Gamma-Ray Bursts (GRBs), the most energetic explosions in the universe, as independent measurements of the Universe’s expansion rate has been discovered in optical wavelength by an international team of 23 researchers led by Maria Dainotti, NAOJ Assistant Professor.

Figure 1: Distribution of GRBs when plotted in a three-dimensional parameter space defined by "peak luminosity of GRB," "luminosity at the end of plateau," and "duration of plateau." The team showed that 179 of the examined GRBs are distributed on a certain plane. Using the three-dimensional correlations, it is possible to calculate unique brightnesses for these GRBs. Credit: Maria Dainotti et al.
The team analyzed 500 optical GRBs — the largest known sample of its kind comprised of data from the Subaru and RATIR Telescopes, among other ground-based facilities, and the Swift satellite — and showed that a specific population of GRBs (179 GRBs) showing optical plateaus, see left panel of Fig. 1, can be used as independent probes of cosmological distances.
Since GRBs are much brighter than the Supernovae (SNe) seen up to 11 billion light years, they can be seen from much farther distances (13.2 billion light-years). This allows a glimpse at distant GRBs, which paint an extraordinary picture of the “infancy” of our 13.8-billion-year-old Universe. Studying the very early Universe is critical to understanding how the first stars were born and how they evolved (cosmological evolution). One painstaking problem is that GRBs are difficult to standardize due to the variety of their features, which vary over several orders of magnitude even when GRBs are observed with a single instrument. Crucially, in some cases, the Subaru Telescope was essential in determining the plateau emission because the data points observed by the Subaru were located in places of the light curves which corresponded to the temporal gaps of other Telescopes, either in the plateau emission or soon after it.
The sample of 179 GRBs are the GRBs that show the plateau emission differently from the other cases in which this peculiar trait is not shown. The different morphology of the light curves also pinpoints a different emission mechanism. GRBs with plateau emission most likely originated from fast-rotating millisecond neutron stars. Other theories explain the plateau emission as accretion onto the central engine, but this is less likely, because of the observed slope of the correlation.
The combination of the three parameters (the peak luminosity of the prompt emission, the luminosity at the end of the plateau, and its duration in optical wavelengths, see Figure 2) identifies a plane that works as the best distance indicator. The novel approach is that for the first time, this correlation survives the tests against selection biases. This relation is an extension of the same 3D correlation in X-rays also found by the same lead author in 2016 (see previous NASA press release Swift: News (nasa.gov)). The fundamental 3D correlation can measure the distance of GRBs. The key merit of the 3D optical relation is that for GRBs with contemporaneous measurements, an average of multiple distances can be calculated, and a more accurate measure will be achieved. More importantly, as a future cosmological probe to determine the cosmological parameters, according to simulations that we have performed in Dainotti et al. 2022c, the 3D optical correlation is even more efficacious for GRB cosmology compared to the X-ray fundamental plane.
The beginning of the plateau emission is different from the time of the prompt emission, which usually coincides with the so-called T90 duration, namely, the time in which the 90% of energy is emitted in the prompt emission.
Another key discovery is that the plateau does depend on the wavelength (chromatic). To reach this conclusion, the team compared X-rays and optical data for 89 GRBs with both X-rays and optical observations. The conclusion is that for the majority of cases, the plateau is not due to a geometric effect because the plateau is chromatic, so we can rule out that the end of the plateau could coincide with the jet break, which depends on the geometric effect of the observer’s viewing angle. This suggests that the 179 GRBs showing the plateau emission most likely originate from a fast-rotating neutron star. This is the first time in the literature this result has been confirmed for such a large sample of events, looking at the slope of the correlation which is still compatible with -1 within 2 σ. A steeper slope compatible with -1.2 would have led to a different conclusion, namely that the emission could have been induced by a prolonged activity of the inner engine accreting material onto a black hole.

Figure 2: GRB sample light curve in artistic visualization. (Credit: Maria Dainotti et al.)
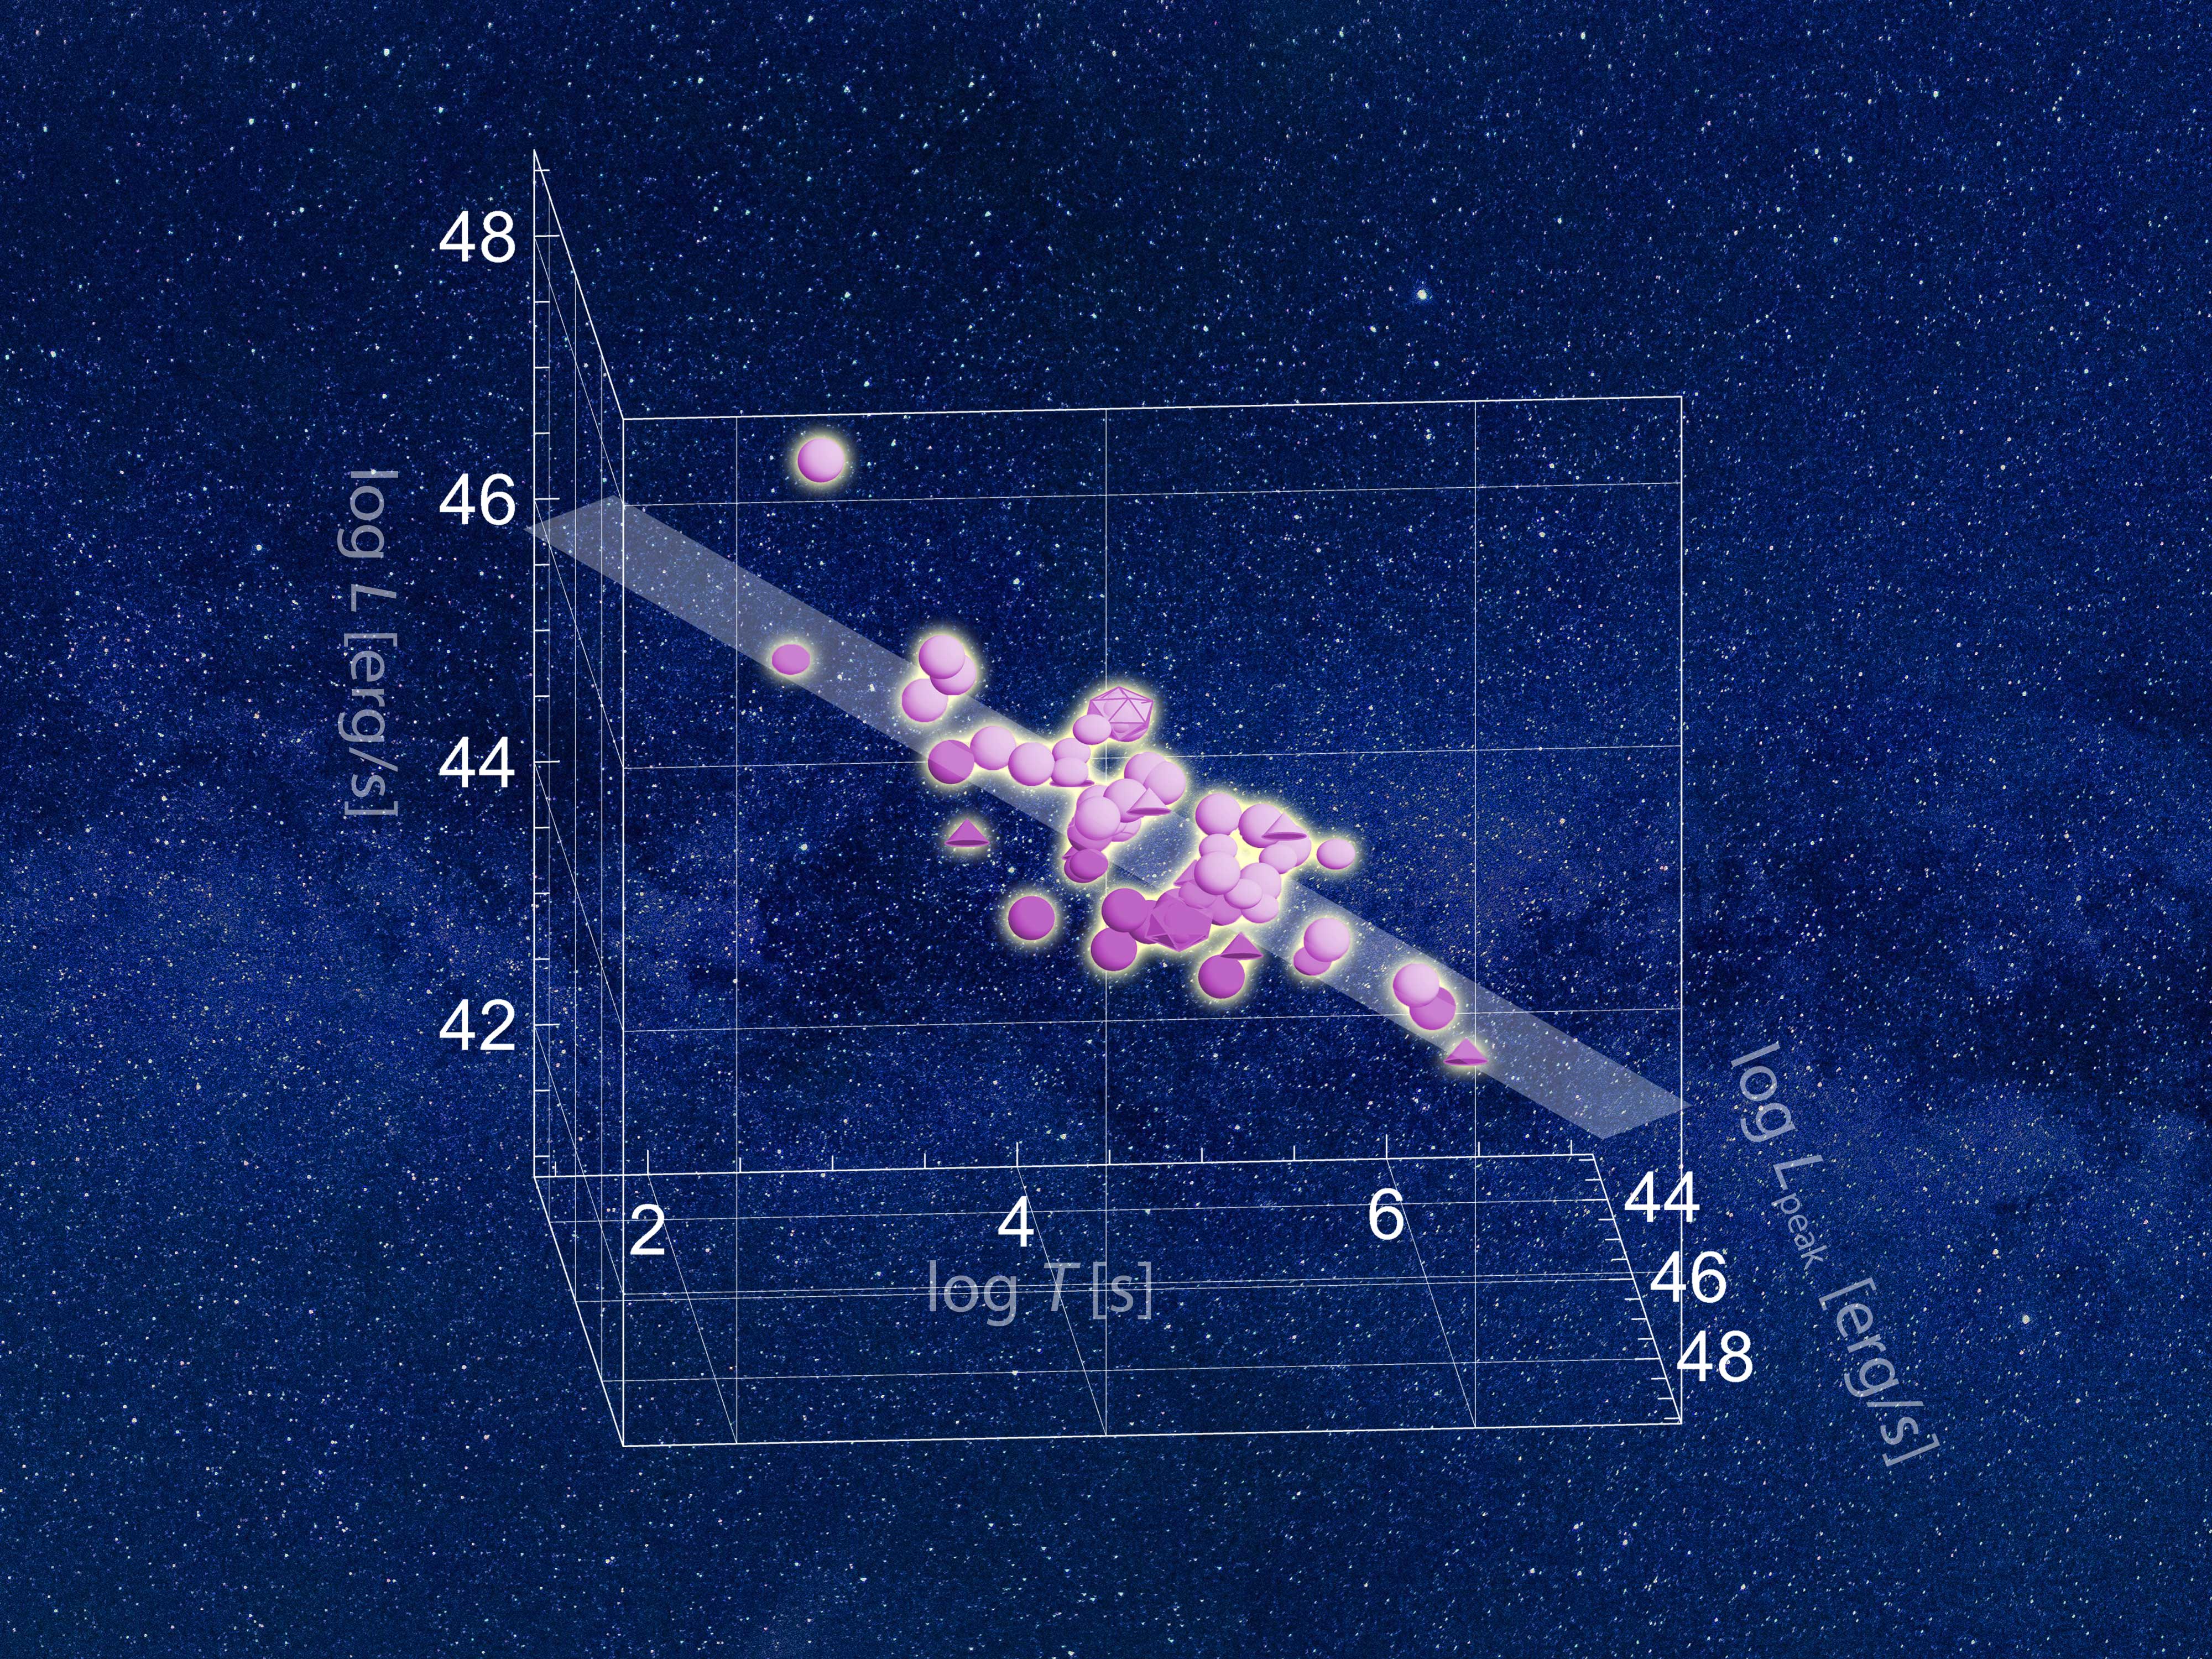
Figure 3: The plane presented in the publication (artistic). (Credit: Maria Dainotti et al.)
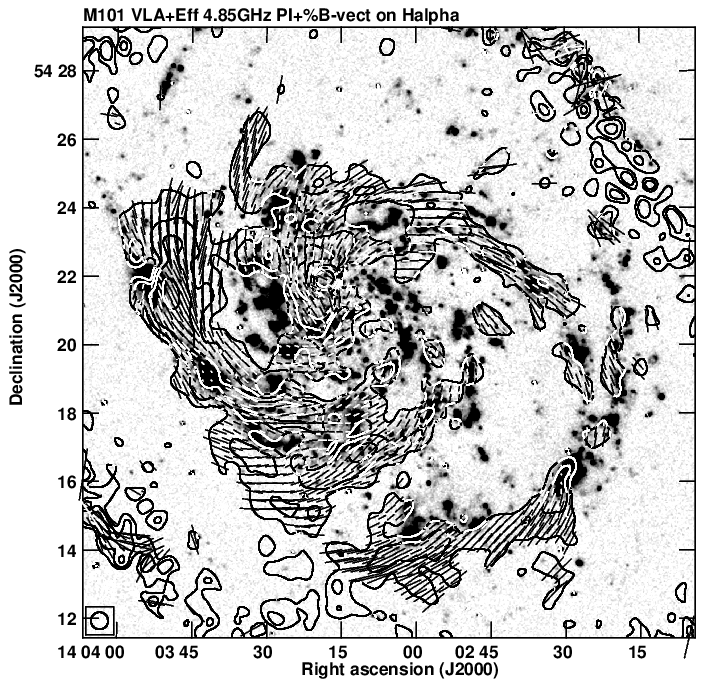
Especially interesting is the map of the polarised radio emission presented in Figure 3. It is quite asymmetric with most of the emission coming from the massive eastern spiral arm and the inter-arm area towards the galactic centre. The orientation of the magnetic field in the latter strongly deviates from the direction along the arm, which suggests that the polarised emission is not directly associated with the spiral arm. Such polarised radio emission in the inter-arm region of a spiral galaxy might give hints for possible magnetic reconnection effects that change some of the turbulent energy of the magnetic field into thermal energy of the surrounding gas. As a result, the order of the magnetic field increases, what is suggested by the map and confirmed by measurements and calculations. The thermal energy transferred to the gas leads to its heating, which is found in the X-ray observations by the XMM-Newton X-ray telescope, also used in our study. A similar search for reconnection heating was also performed for another grand-design spiral galaxy – M83.
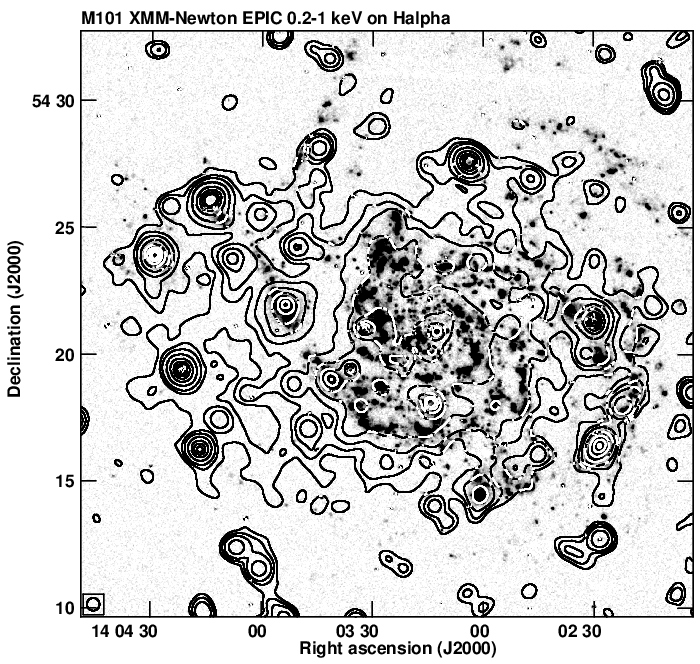
Another interesting area of M101 is found between the central part of the disk and the western spiral arm. Figure 3 shows that this is a relatively 'empty' area, where neither Hα nor polarised radio emission is present. The total radio emission (right panel of Figure 2) is also weak in this position and the study of the emission from the neutral hydrogen performed by Braun (1995, A&AS, 114,409) reported a significant depression in this area. Nevertheless, the soft X-ray map that presents the emission from the diffuse hot gas does show notable extension there (Figure 4). The analysis of the associated hot gas suggests that it is slightly hotter than the surrounding medium. If this was confirmed by more sensitive observations, that would mean that also in this area the gas heating by the magnetic reconnection is possible. Although, as mentioned before, no polarised radio emission is present there, the two frequency radio study performed by Berkhuijsen et al. (2016, A&A, 588, 114) suggest the existence of the vertical magnetic field in this part of the galaxy. This in turn would mean, that the magnetic reconnection might occur in the halo of M101.
Contact
|
Kamil Kalinowski Astronomical Observatory |
Original publication
Dainotti et al., The Optical Two and Three-Dimensional Fundamental Plane Correlations for Nearly 180 Gamma-Ray Burst Afterglows with Swift/UVOT, RATIR, and the SUBARU Telescope, Astrophysical Journal Supplement Series (2022).M101, also known to many sky enthusiasts as the Pinwheel Galaxy, is big, beautiful and... making troubles. Until recently, there were no radio observations of this galaxy at high frequencies that could provide a detailed view of its radio structure or give hints about its magnetic fields at smaller scales. The reason is that this galaxy is so large in the sky that it is difficult to be observed with radio interferometers.
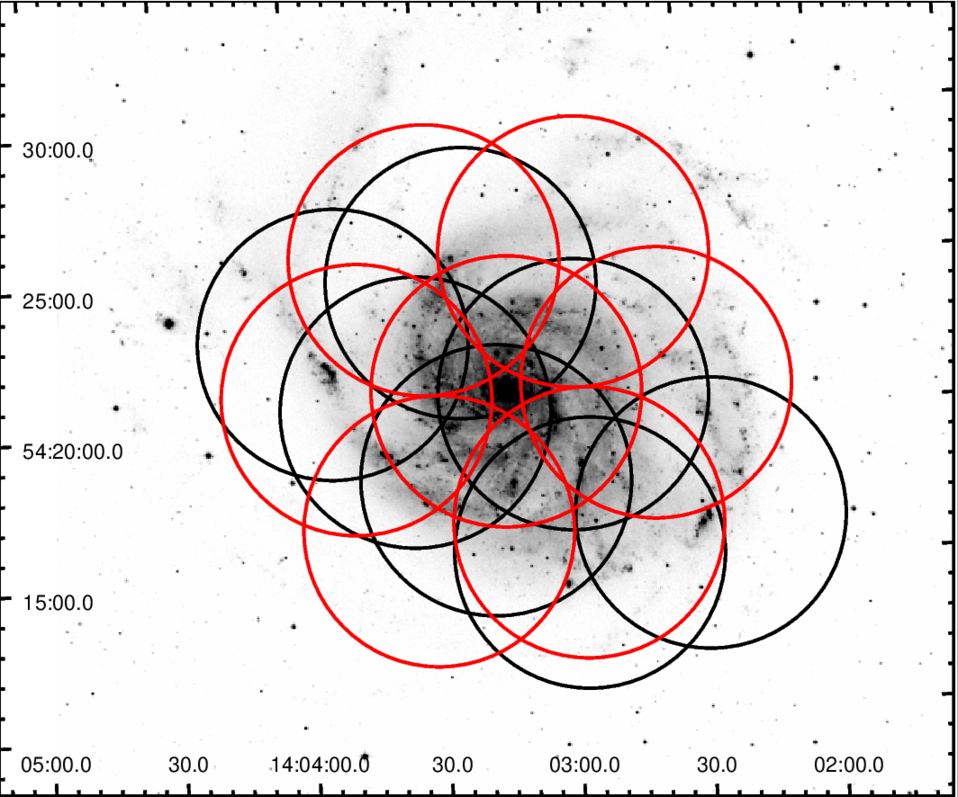
Figure 1: DSS blue image of M101 with all observation pointings marked with circles. See text for details. Credit: OAUJ.
Of course, when this galaxy is observed with a single-dish radio telescope, it is sufficient to just scan the appropriate area of the sky to fully map the galaxy. This was already done by Berkhuijsen et al. (2016, A&A, 588, 114), who presented an extensive analysis of the radio data obtained with the 100-m Effelsberg radio telescope. This study, however, was performed with a relatively low resolution of 2.5 arc minutes at the wavelength of 6 cm. To achieve higher resolutions, interferometric observations, that is, with the use of an array of radio telescopes, are required. All radio telescopes (antennas) within this array observe the same object on the sky and the signal from all of them is correlated and combined. The straightforward advantage of this system is that the size of the array, that is, the longest distance between antennas determines the highest resolution possible.
Of course, when this galaxy is observed with a single-dish radio telescope, it is sufficient to just scan the appropriate area of the sky to fully map the galaxy. This was already done by Berkhuijsen et al. (2016, A&A, 588, 114), who presented an extensive analysis of the radio data obtained with the 100-m Effelsberg radio telescope. This study, however, was performed with a relatively low resolution of 2.5 arc minutes at the wavelength of 6 cm. To achieve higher resolutions, interferometric observations, that is, with the use of an array of radio telescopes, are required. All radio telescopes (antennas) within this array observe the same object on the sky and the signal from all of them is correlated and combined. The straightforward advantage of this system is that the size of the array, that is, the longest distance between antennas determines the highest resolution possible.
This is because the measured signal is Fourier-transformed so that the largest scales (distances between antennas) in the array correspond to the smallest scales in the obtained map. At the same time, the smallest scales (distances between antennas) correspond to the largest scales in the map. These largest scales is simply extended (often low surface-brightness) radio emission. Unfortunately, because it is impossible to bring the antennas very close to each other (due to their size or shadowing), we will miss some of these smallest distances (called baselines) and consequently the largest scales in the map. This lack of the shortest baselines is called the missing zero-spacing effect, which results in the largest angular scale (LAS) that can be imaged in the map. For the already mentioned wavelength of 6 cm, the observations performed with the use of the Karl Jansky Very Large Array (JVLA) allow for a detection of emission at scales not larger than around 4 arc minutes, which is not much for typical nearby galaxies, not to mention M101. This obviously causes that a substantial amount of the radio emission is missing in the maps of such objects.
Another property of the interferometric observations that makes the imaging of larger objects difficult is the primary beam – the diffraction limited response of the individual antennas in the array, or, more practically, the field of view. If we want to make the most of our observations, we should focus on the most sensitive central part of this area. As a result, to image an angularly extended object, such as the spiral galaxy M101, many separate observations (so-called pointings) are needed. Figure 1 presents all observations used to produce the radio maps of M101 with archive and more recent dedicated pointings marked with black and red circles, respectively. Despite the complexity of the pointing layout used, the emission lost due to the LAS, mentioned before, cannot be restored that way. The only possibility is to combine these observations with the ones performed with the single-dish radio telescope.
The shortest baselines allowed by the JVLA are 85 metres which perfectly corresponds to the diameter of the Effelsberg radio telescope (100 metres). In other words, we can now use the single-dish data to restore the signal that is not provided by the JVLA for baselines shorter than 85 metres. This makes the combination of these data relatively easy and efficient. The left panel of Figure 2 presents the radio map of M101 at 6 cm as visible by the JVLA only. The strong gradients of the emission visible as dense contours are typical for interferometric observations, in which some of the faint large-scale emission is missing. In the right panel of the same figure the combined JVLA and Effelsberg data are presented and the restored extended radio emission is clearly visible. The flux measurements show that in the left map (i.e. interferometric observations only) as much as 60% of the emission is lost. The right map, in which the entire emission has been restored, allows for precise flux measurements in smaller areas of the galaxy.
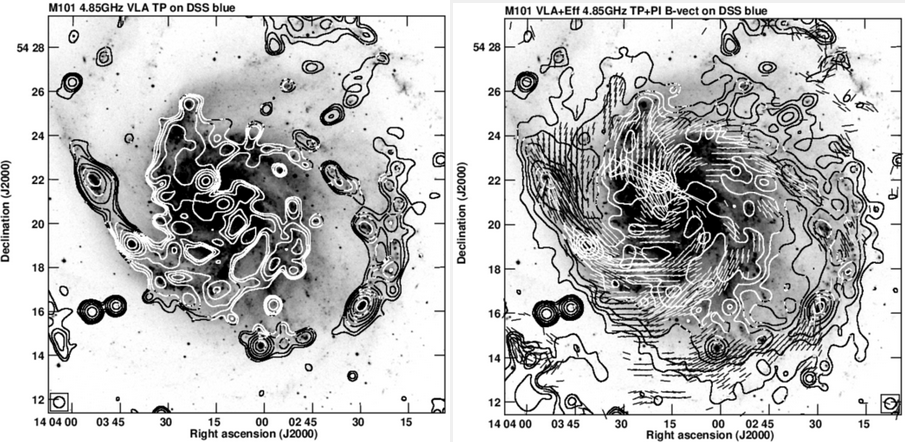
Figure 2: DSS blue image of M101 with contours of the radio emission: JVLA data (left) or combined JVLA+Effelsberg data (right). The combined data map also shows the orientation of the magnetic field and the length of the lines is proportional to the polarised radio intensity. Credits: OAUJ.
Especially interesting is the map of the polarised radio emission presented in Figure 3. It is quite asymmetric with most of the emission coming from the massive eastern spiral arm and the inter-arm area towards the galactic centre. The orientation of the magnetic field in the latter strongly deviates from the direction along the arm, which suggests that the polarised emission is not directly associated with the spiral arm. Such polarised radio emission in the inter-arm region of a spiral galaxy might give hints for possible magnetic reconnection effects that change some of the turbulent energy of the magnetic field into thermal energy of the surrounding gas. As a result, the order of the magnetic field increases, what is suggested by the map and confirmed by measurements and calculations. The thermal energy transferred to the gas leads to its heating, which is found in the X-ray observations by the XMM-Newton X-ray telescope, also used in our study. A similar search for reconnection heating was also performed for another grand-design spiral galaxy – M83.
Another interesting area of M101 is found between the central part of the disk and the western spiral arm. Figure 3 shows that this is a relatively 'empty' area, where neither Hα nor polarised radio emission is present. The total radio emission (right panel of Figure 2) is also weak in this position and the study of the emission from the neutral hydrogen performed by Braun (1995, A&AS, 114,409) reported a significant depression in this area. Nevertheless, the soft X-ray map that presents the emission from the diffuse hot gas does show notable extension there (Figure 4). The analysis of the associated hot gas suggests that it is slightly hotter than the surrounding medium. If this was confirmed by more sensitive observations, that would mean that also in this area the gas heating by the magnetic reconnection is possible. Although, as mentioned before, no polarised radio emission is present there, the two frequency radio study performed by Berkhuijsen et al. (2016, A&A, 588, 114) suggest the existence of the vertical magnetic field in this part of the galaxy. This in turn would mean, that the magnetic reconnection might occur in the halo of M101.
Contact
|
Marek Weżgowiec Astronomical Observatory
|
Original publication
Marek Weżgowiec, Rainer Beck, Michał Hanasz, Marian Soida, Matthias Ehle, Ralf-Jürgen Dettmar, Marek Urbanik, Magnetic fields and hot gas in M101, accepted for publication in A&A.
The research was conducted at the Department of Radioastronomy and Space Physics of the Jagiellonian University’s Astronomical Observatory (OA UJ). The work was supported by the Polish National Science Centre through the grant 2017/27/B/ST9/01050.
High precision time measurement is necessary in many fields of astronomical research. This includes the analysis of optical radiation variability of stars and quasars conducted at OAUJ. Dedicated servers transferring time via the NTP protocol have been set up at the Jagiellonian University Astronomical Observatory in Cracow for the precise time recording. It is a continuation of a long tradition of providing time signal by the Cracow Observatory.

Illustration 1: The face of one of the clocks used for time service at the Cracow Observatory. Credit: OAUJ.
Astronomers, like few others, need very high precision timing to conduct their research. Time servers present at OAUJ were developed as a part of studies on optical variability of stars and quasars carried out by the team of Prof. Zola. Additionally, these servers have been used in many of our other observations and research works.
The precise knowledge of time is also important in everyday life. Only a few centuries ago, errors in measuring time, and thus inaccurate determination of longitude, caused huge economic losses as a result of commercial shipwrecks. Today, knowledge of the precise time is used, among others, by various types of telecommunication systems. For several years, the OAUJ has been providing a time service through the Internet, making it possible to synchronize time in computer systems with the standard time, thus serving numerous public and private entities not related to astronomy. This activity is somewhat of a continuation of the OAUJ's tradition of providing a time signal. In the years 1946 to 1984 we broadcasted precise analogue time stamps nationwide at 12 o'clock on Polish Radio. Both of our time servers are available to the public — 24/7 and free of charge. The NTP protocol allows time synchronization with uncertainties ranging from tenths of a second to single milliseconds, and in some cases to several microseconds. Statistics completed in the autumn of 2021 show that the average number of time requests to OAUJ servers is 210,000/hour.
The servers provide accurate time to computers worldwide, but by the nature of the NTP protocol, machines located in Poland and surrounding countries predominate. The OAUJ servers are used by individual users and companies for which the exact time of computer operating systems is a critical issue. These include airports and commodity and energy trading exchanges. The source of time are high quality receivers: GPS and radio DCF. OAUJ servers are very often requested for time because their primacy over other similar devices lies in the fact that they are very accurate, stable and reliable due to frequent checks. The internal timing accuracy of our two servers is 10 μs and 12 ms.
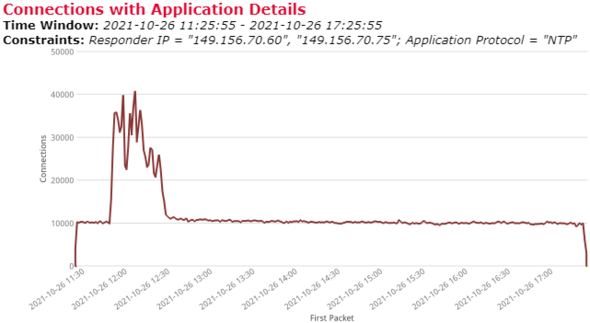
Illustration 2: An example plot of temporal query statistics for the time servers at OAUJ. Credits: OAUJ.
This timing pattern at OAUJ has been used in many observations and research works, including the analysis of optical variability of the OJ287 system of two supermassive black holes (Valtonen, M. J., Zola, S., et al., ApJ, 2019, 882, 88).
Contact
|
Staszek Zoła Astronomical Observatory |
Original publication
Budyn, M., Zoła, S., Wójcik, K., JAstroCam — A New Tool for Data Gathering with CCD, ASPC, 435, 87 (2010).
The work is part of research conducted at the Department of Stellar and Extragalactic Astronomy of the Jagiellonian University’s Astronomical Observatory.
Over a seven year an international team including scientists from OAUJ has mapped more than a quarter of the northern sky using the Low Frequency Array (LOFAR), a pan-European radio telescope. It reveals an astonishingly detailed radio image of more than 4.4 million objects and a very dynamic picture of our Universe. This treasure trove of data is now public, so anyone can view the most exotic wonders of our intriguing Universe in a brand new light.
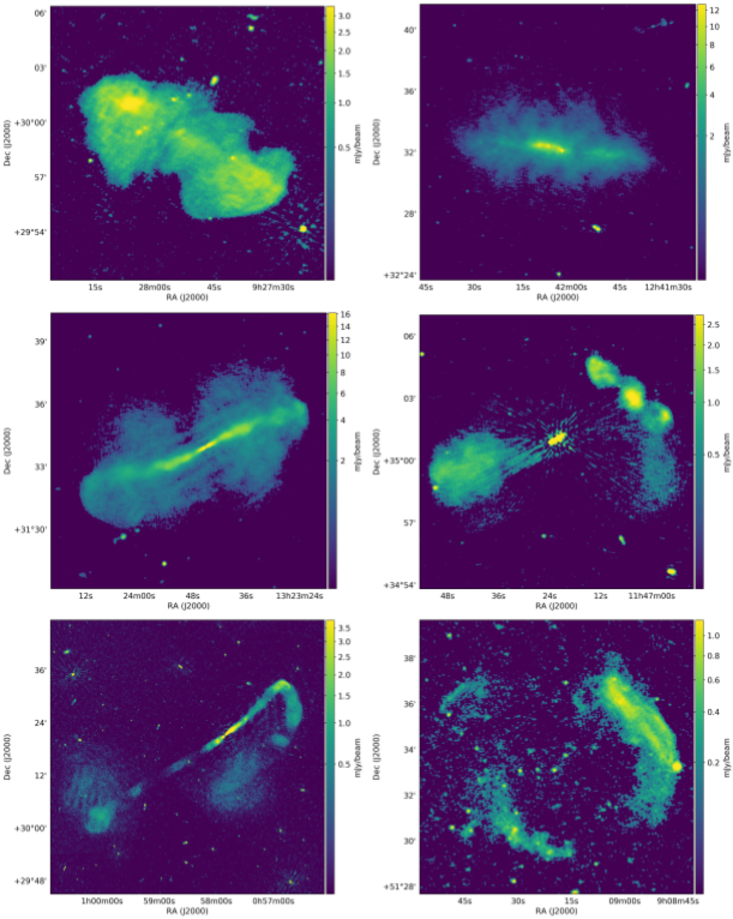
Illustration: LOFAR LoTSS-DR2 radio maps for the selected radio sources. Clockwise, starting from the upper left image: radio galaxy B2 0924+30, galaxy NGC 4631, BL Lacertae B2 1144+35, Abell 746 galaxy cluster, radio galaxy NGC 315, radio galaxy B2 1321+31. Credit: The Authors.
The vast majority of these objects are located billions of light years away and are either galaxies that harbour massive black holes or rapidly growing new stars. Rarer objects that have been discovered include colliding groups of distant galaxies and flaring stars within the Milky Way.
The wealth of new information in the maps is evident from a burst of recent scientific publications that make use of the radio images. Astronomers from numerous institutes have explored all types of objects with these data. For example, the team published the largest ever studies of colliding clusters of hundreds to thousands of galaxies offering new insights into magnetic fields and high energy particles in the Universe’s largest structures.
Previous results include finding curious signals from nearby stars that may be induced by orbiting exoplanets; pin-pointing the slowest-spinning pulsar that challenges the current theories describing such objects; observing so-called jellyfish galaxies shedding material as they travel through the surrounding medium; witnessing eruptions of black holes that shape their local environment; probing the fabric of the cosmic web through the locations and shapes of galaxies, shedding new light on the most distant super-massive black holes in the Universe; and the discovery of so many radio galaxies of all shapes, sizes and ages that a dedicated citizen science project has been set up to help find new black holes in this zoo of objects. Whilst these discoveries are already refining our understanding of the Universe, it is also clear that the work that has been conducted to date only scratches the surface of what is to come.
To produce the map, state-of-the-art data processing algorithms were deployed on high performance computers all over Europe to process 3,500 hours of observations that occupy 8 petabytes of disk space – the equivalent to roughly 20,000 laptops. This data release, which is by far the largest from the LOFAR Two-metre Sky Survey, presents about a million objects that have never been seen before with any telescope and almost four million objects that are new discoveries at radio wavelengths. The data in the release can be used to search for a wide range of signals, such as those from nearby planets or galaxies right through to faint signatures in the distant Universe.
Contact
|
Krzysztof Chyży Astronomical Observatory |
Original paper
T. W. Shimwell et al., The LOFAR Two-metre Sky Survey. V. Second data release, A&A 659, A1 (2022).
The work is part of research conducted at the Department of Radio astronomy and Space Physics of the Jagiellonian University’s Astronomical Observatory. This work was supported by the Polish National Science Centre through the grants 2018/29/B/ST9/02298 and 2018/29/B/ST9/01793. The maintenance of Polish LOFAR stations is financed by the Ministry of Education and Science.
On Wednesday, February 23, 2022, during its testing on the grounds of the observatory at the Astronomical Institute of the Czech Academy of Sciences in Ondřejov, one of the two SST-1M Cherenkov telescopes recorded its first events initiated by high-energy particles of both the hadronic origin and originating from gamma-ray photons.
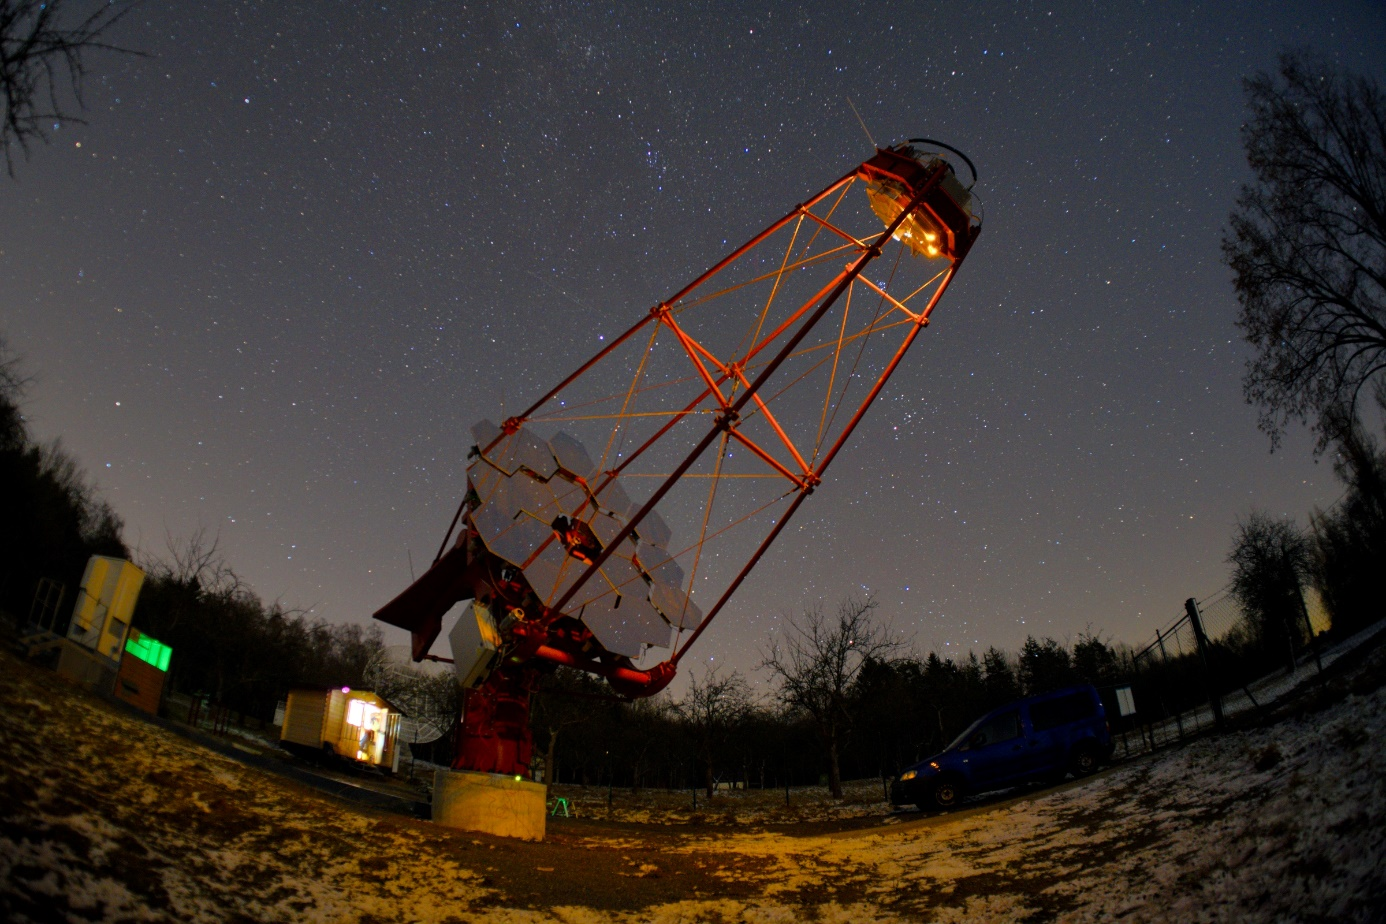
The SST-1M telescope during observations at the Ondřejov Observatory. Credit: The Team.
The SST-1M telescopes detect gamma-rays from cosmic high-energy sources in our Galaxy or in the extragalactic space. Recent data have been recorded in several celestial directions, including the surroundings of the Crab Nebula. The data include not only images of extensive air showers of many secondary particles created during the interactions of the primary particles in the atmosphere (Illustration 2), but also records of individual particles in the showers, in particular muons, seen as “muon rings” in the camera (Illustration 3). Muons are the clear signature of hadronic origin.
Two SST-1M (Single-mirror Small-sized) telescopes have been built at the Ondřejov Observatory since 2021. These telescopes were originally conceived as prototypes for the entire class of small- sized telescopes for the Cherenkov Telescope Array (CTA) project. The two SST-1M prototypes were first assembled as single units at a test site at the Institute of Nuclear Physics PAN in Kraków, Poland. In 2021 the telescopes were transported to and installed in Ondřejov. The first telescope is now fully operative and undergoes commissioning that includes first data taking. The second telescope will be equipped with its camera in about a month. After that the two SST-1M telescopes will for the first time start to take data together in the stereoscopic mode. One should note that the location at the Ondřejov Observatory offers a much better observing conditions than available at the test site in Kraków.
The goal of the installation is to optimize the properties of the whole system, observe sources of cosmic gamma rays with energies in the range up to several TeV and then eventually deploy the well-tested telescopes at a final observing site at a higher altitude above the sea level and better weather conditions within a selected international project.
The SST-1M team is composed of members from multiple institutions in Poland, Czech Republic, Switzerland, and Ukraine. It is led by the University of Geneva. The responsibility for the optical system of the telescopes lies with the Czech Partner (Joint Laboratory of Optics of the Institute of Physics CAS and Palacky University Olomouc). The Astronomical Institute CAS hosts the SST-1M mini-array and provides support for the construction and operation of the telescopes. Polish contribution is led by the Institute of Nuclear Physics PAN, where the mount of the telescope and its control system have been designed, built and tested. Nicolaus Copernicus Astronomical Center PAN in Warsaw is responsible for the telescope pointing and mirror alignment systems, and also camera and telescope servers and software. Space Research Center PAN in Warsaw designed the mirror actuators and contributed a complete set for one of the telescopes. Jagiellonian University and AGH University of Science and Technology in Kraków developed and contributed to manufacturing the fully digital electronics for the camera, that digitizes the photon signals from all camera pixels despite their short duration of a few nanoseconds and the high rate of backgrounds due to night sky background. The Polish party has also contributed significant funds towards the construction of the necessary infrastructure in Ondřejov. The Swiss partners at the University of Geneva have designed and built the mechanical parts of the camera and a unique detection system of Cherenkov light based on a new technology using silicon photomultipliers (SiPM), only recently deployed in gamma-ray astronomy.
In Jagiellonian University the project is realized in Astronomical Observatory. Here, in the CTA Electronic Laboratory, Eng. Krzysztof Ziętara is co-leading current efforts on optimization of the camera operation, while research program for the SST-1M project is partly elaborated in the Department of High Energy Astrophysics.
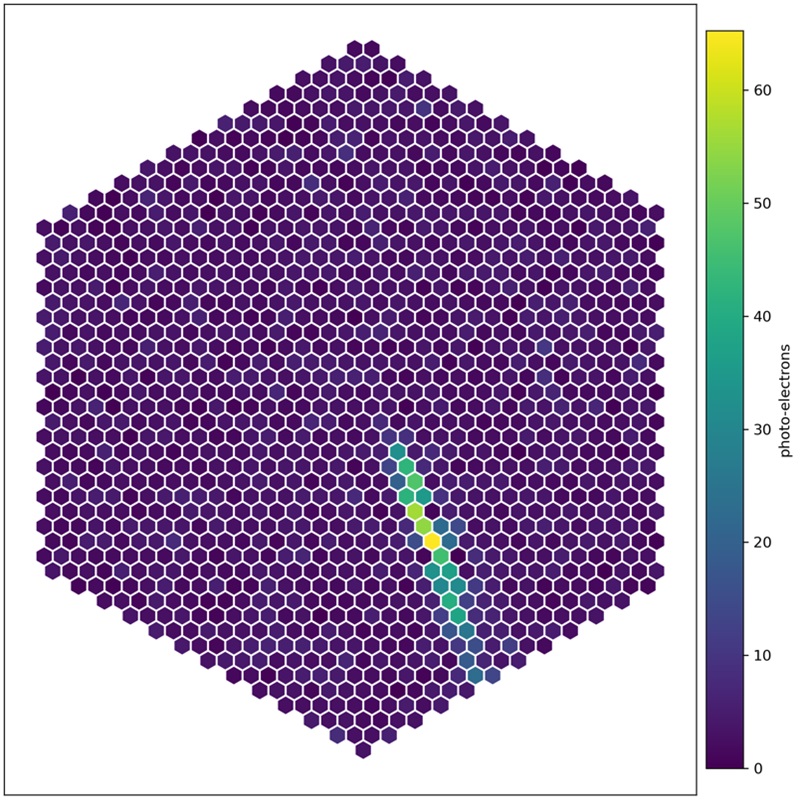
Image of the Cherenkov light of an atmospheric air shower in the camera of the SST-1M telescope, initiated by a gamma ray. The image has an elongated shape that indicates the position of the source. Credit: The Team.
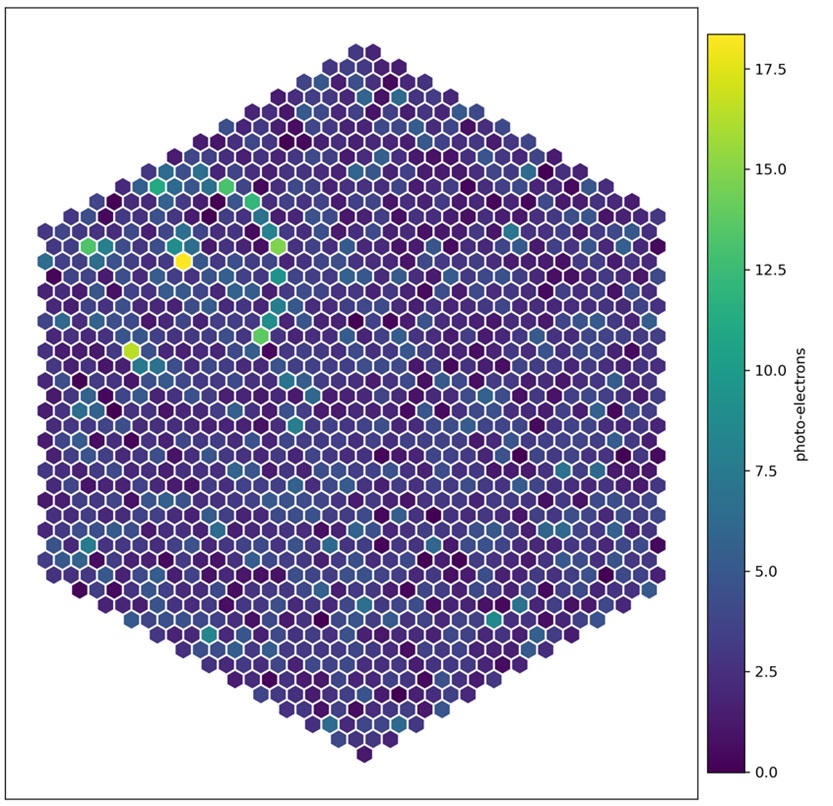
Ring-shaped image of a muon recorded by the camera of the SST-1M telescope. Credit: The Team.
Contact
|
Prof. dr hab. Jacek Niemiec Institute of Nuclear Physics Prof. dr hab. Michał Ostrowski Astronomical Observatory |
The work is part of research conducted at the Department of High Energy Astrophysics of the Jagiellonian University’s Astronomical Observatory.
The financial resources enabling the project to be implemented were granted by the Minister of Science and Higher Education through decision No. DIR/WK/2017/12 on financing the costs of the national contribution to participate in a joint international program entitled: "Technology demonstrator for a mini-array of small Cherenkov telescopes for the CTA project". The program is coordinated by the Institute of Nuclear Physics PAN on behalf of the "Polish Consortium of the Cherenkov Telescope Array Project".
Publicly available data is not too popular among scientific breakthrough seekers. Usually they were extensively researched and there is nothing more to discover. However, there are exceptions, such as the quasar HE 0435-5304, which sounds boring by name.
An image of the quasar HE 0435-5304 (the central point in the image, marked with a pink cross) together with its immediate surroundings. The image was assembled from several photos in different filters. Credit: The Authors.
Determining the distance to cosmic objects allows us to estimate how much energy they produce and what processes are responsible for their glow. This is especially interesting when an object appears to be an extreme case in the population. The quasar HE 0435-5304 is unique in many ways due to its high luminosity and above-average activity.
An interesting object with quite a boring name HE 0435-5304 was taken under scrutiny by scientists from the National Centre for Nuclear Research (NCNR) and Astronomical Observatory of the Jagiellonian University (JU). It is a quasar*, visible in the southern sky in close proximity to the southern ecliptic pole. As an area far from the galactic disk it is not as obscured with dust and has a lower number of stars. Because of that it is one of the best “windows” to distant Universe outside our Galaxy. Therefore, based on observations by the Japanese satellite AKARI, a survey called Akari Deep Field-South (ADF-S) has been performed there, identifying a number of galaxy candidates for Luminous and Ultra Luminous Infrared Galaxies (LIRG/ULIRG**).
Quasar HE 0435-5304 has caused many problems in its analysis from the beginning. According to earlier spectroscopic measurements, the results of which can be found in publicly available catalogues and scientific papers, it was supposed to be distant from us by 8.7 billion light years. Meanwhile, already the first estimates of the Polish team indicated that a much smaller distance - about 3.5 billion light years - was much more likely. These estimates, however, were based on photometric measurements, which are assumingly less accurate than spectroscopic measurements.***
Measuring the physical properties of a quasar and its parent galaxy requires knowledge of its distance. Assuming a distance of 8.7 billion light-years, HE 0435-5304 appeared to be a very unusual object, with extremely high star formation rate, even in the category of galaxies undergoing a burst of star-forming activity. The standard physical analysis results obtained indicated the completely exotic, monstrous nature of this quasar, forming huge numbers of new stars.
However, it turned out that another research team, based on the ultraviolet spectrum, estimated the distance to HE 0435-5304 at 4.3 billion light years, which is also significantly below the catalogue value. Researchers from NCNR and JU decided to finally solve the problem of the distance to the quasar HE 0435-5304. They performed observations with the Southern African Large Telescope (SALT), in which Poland has a 10% financial share, and therefore also observing time. Based on their own observations, they measured the optical spectrum of the quasar. In their research they also used data from ESO's Very Large Telescope (VLT).
It turned out that quasar HE 0435-5304 is 4.5 billion light years away from us - almost twice as close as previous measurements published 20 years ago suggest. Further analysis has revealed that at the centre of the object is a supermassive black hole with a mass of 117 million solar masses, and that strong (although not as extreme as previously thought) star-forming processes are taking place in its parent galaxy. The galaxy is heavily dusty, but the dust obscures the stars but does not cover the nucleus itself - the quasar. HE 0435-5304 is most likely in the process of merging with another galaxy, which could both initiate new star formation and stimulate quasar activity. The quasar itself belongs to the rare Extreme Type A population.
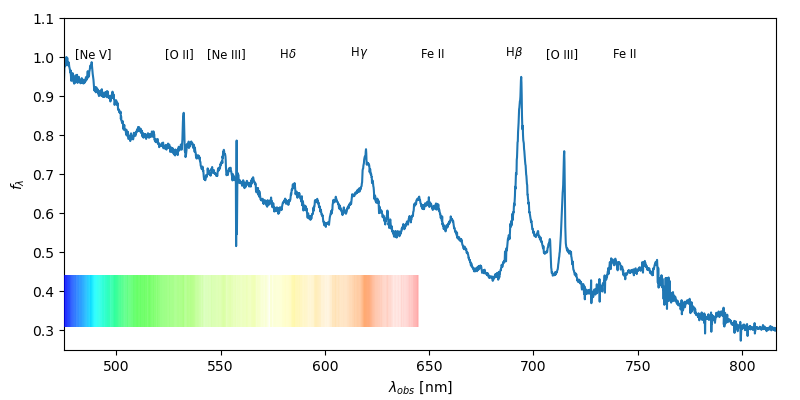
Figure 2: The spectrum of the quasar HE 0435-5304 with the emission lines of elements (ions) marked. This figure presents the wavelength dependence of the intensity of the light emitted by the quasar. The colored bar at the bottom of the graph indicates the visible part that would be seen by looking through a prism without a camera. Credit: The Authors.
– Our analysis of the high-quality spectra shows that HE 0435-5304 is an extreme object of population A. – says Dr Krzysztof Hryniewicz from the NCNR Astrophysics Facility – Population A are those active galactic nuclei in which massive black holes accretes matter faster than the rest of the population. They are bright objects that are successfully used in studies of the distant Universe. In particular, the outermost group in this classification is the NLSy1 (Narrow Line Seyfert 1) group, with the narrowest emission lines. The activity of active galaxies is also indicated by the emission spectrum of iron, especially in the optical range. Based on the very strong iron ion emission we classified HE 0435-5304 into group xA, i.e., objects with extreme galactic nucleus activity and due to narrow lines close to NLSy1 objects. It is interesting to note that the intensity of these processes and the position of the quasar itself in the population changes noticeably with time. Unfortunately, the precision with which we could measure this effect is limited by the influence of the Earth's atmosphere. We believe that this variability is related to a gradual decrease in the luminosity of the object. Additionally, the hydrogen emission lines have more complex shapes than in other active galactic nuclei with similar activity levels in the A population.
– This is an exciting result given that HE 0435-5304 is very bright in the infrared wavelength range (it is an ULIRG), and is perhaps in the process of rapid mass growth in the merger of two galaxies. – adds Małgorzata Bankowicz, a PhD student from the Astronomical Observatory of the Jagiellonian University who studies the properties of ULIRGs. – It is therefore very likely that the very rapid changes that are occurring in it (compared to the lifetimes of active galaxies) are due precisely to the unique evolutionary stage of the entire galaxy. Despite the clues provided by our analysis, it is still an open question whether there is a double black hole at the heart of HE 0435-5304 – even before merging in a galactic merger.
The research of the NCNR and JU teams confirms an old scientific principle: repeatability of measurements guarantees their reliability. And they show that even a seemingly well studied object may turn out to be a surprise quasar.
* Quasars are distant active galactic nuclei of immense brightness. Their brightness is so great that their parent galaxies are not visible and look like stars. However, they are distinguished from stars by their distance from us and by their spectrum, which, unlike the absorption spectrum of stars, is emissive. This property is also why quasars are used to study the intergalactic medium, among other things.
** Luminous Infrared Galaxies (LIRGs) and Ultra Luminous Infrared Galaxies (ULIRGs) are rare and not well studied galaxy types. They are characterised by high bolometric luminosity in the infrared part of the electromagnetic spectrum and low luminosity in the optical part. The total infrared luminosity of LIRG-type galaxies is in the range of 1011-1012 solar luminosity, while that of ULIRG-type is 1012-1013 solar luminosity.
*** Depending on the scale of distances in the Universe, different methods of distance measurement are used in astrophysics, and the greater the distance, the more difficult it is to measure and the greater the uncertainty. In the case of the most distant objects, the concept of redshift is used. The redshift is defined as the ratio of the observed wavelength of light to the (presumed) wavelength emitted by the object, minus one, and indicates a significant distance in the Universe. Two methods are distinguished in redshift measurements: spectroscopic and photometric. The spectroscopic method of determining redshift, based on emission or absorption lines of elements identified in the spectrum of an object, is unquestionably considered by astronomers and astrophysicists to be the most accurate. The photometric method, on the other hand, based on model fitting of the spectrum to brightness "peaks" on given lengths of photometric filters, is statistically good, but much less accurate than the spectroscopic method, used only to estimate this value. It is therefore quite well suited for a global approach on whole catalogues.
Contact
|
mgr Małgorzata Bankowicz Astronomical Observatory M. Bankowicz [at] oa.uj.edu.pl |
Original publication
Hryniewicz, Krzysztof; Bankowicz, Małgorzata; Małek, Katarzyna; Herzig, Aleksander; Pollo, Agnieszka, AGN in the ULIRG HE 0435-5304 (Article soon to be published in Astronomy & Astrophysics).
The research was conducted at the Department of Stellar and Extragalactic Astronomy of the Jagiellonian University’s Astronomical Observatory (OAUJ). Research carried out under funding obtained from the National Science Centre (UMO-2018/30/M/ST9/00757, UMO-2016/23/N/ST9/01231, UMO-2018/30/E/ST9/00082). Data from the SALT telescope were acquired as part of the Polish contribution funded by the Ministry of Science and Higher Education (DIR/WK/2018/12).
How does ultraviolet radiation influence the process of forming new stars and the entire planetary systems? The topic remained largely unexplored until astronomers from UMK and UJ have decided to take a closer look. The results they have achieved can provide more details concerning our origins in space.
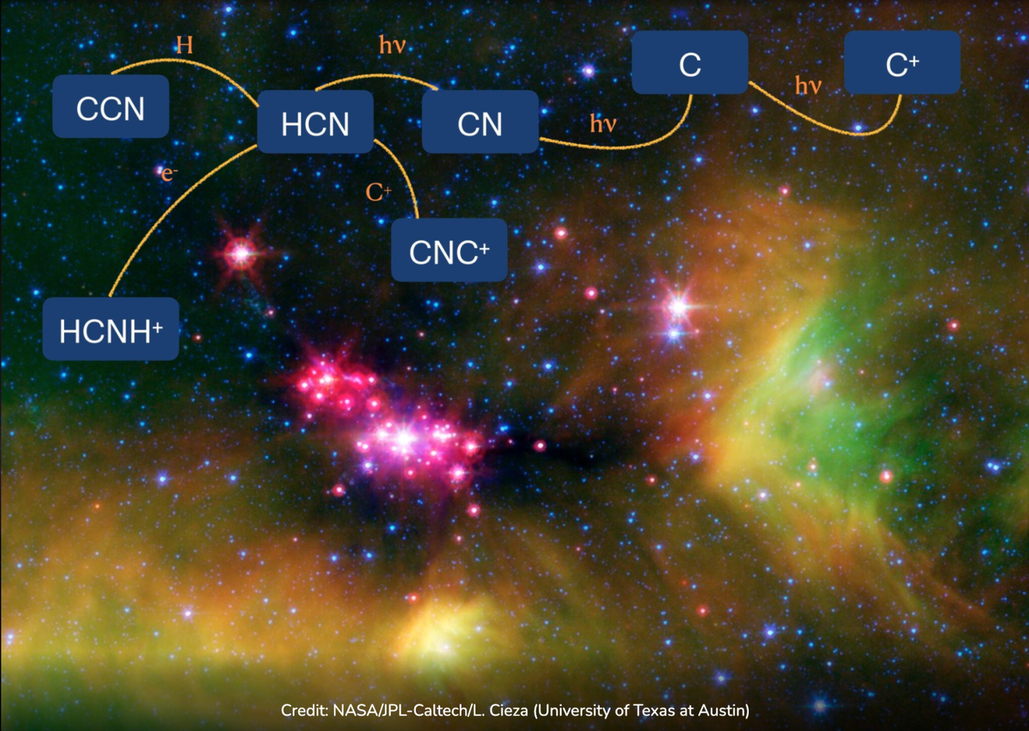
Illustration: Infant stars are glowing gloriously in this infrared image of the Serpens star-forming region, captured by NASA's Spitzer Space Telescope. Credit: NASA/JPL-Caltech/L. Cieza (University of Texas at Austin).
Protostars are young, still forming stars. In the future, they will produce energy from the nuclear fusion. Dr Agata Karska from the Institute of Astronomy at the Faculty of Physics, Astronomy and Informatics, NCU, and mgr Agnieszka Mirocha from OAUJ, together with collaborators, are concerned with the UV radiation observed in the vicinity of protostars and its meaning for the formation of new objects as well as planetary systems surrounding them. How do low-mass objects such as our Sun form? Thanks to this field of research we can also gain new information concerning distant past of our planet Earth.
Young stars can be found in clouds composed of dust and gas, impermeable to visible light, which makes observations of such objects quite problematic. Observations at longer electromagnetic waves, particularly in the far infrared, are necessary because this is where the dust brightness peaks, and also in the sub-millimeter range with key molecular transitions useful for the measurements of the temperature and density of a gas surrounding a protostar. While visible and ultraviolet light are completely absorbed by dust grains, due to observations of rotational lines of molecules in the sub-millimeter range we are able to determine the temperature and density of the gas as well as the amount of different molecules surrounding a protostar. With such knowledge, one can draw conclusions concerning physical and chemical processes leading to the formation of stars and planets.
By analyzing the presence of water molecules around protostars it was earlier possible to confirm the occurrence of UV radiation in low-mass star-forming regions. However, the observations were carried out with the use of the Herschel space telescope and could not be continued since its mission was accomplished in 2014. Thus, the researches had a different idea: they proposed to use the HCN and CN molecules, which can be also observed directly from the Earth's surface. Recent studies based on observations of these molecules with the use of the IRAM telescope located in Spain can be found in the new article published in a prestigious "Astronomy & Astrophysics" journal. Its first author is Agnieszka Mirocha, astronomer from the Jagiellonian University in Cracow.
The idea was based on taking a closer look at the presence of two molecules, namely, HCN and CN, in a molecular cloud in the star-forming Serpens region, named Serpens Main. They were considered as the indicators of where and how intensely UV radiation occurs. There are various molecules presenting different properties in a gas found in the cloud surrounding the protostar. Their abundance in such gas results from the efficiency of chemical reactions leading to their production and destruction, which depend on physical conditions as well as additional processes such as illumination with UV radiation.
Until recently, astronomers were not certain whether protostars are the source of UV radiation. At present, we know that even though they do not emit it themselves, the matter falling from a disk onto a star not only changes the structure of a shock wave leading to increased compression of a gas but also creates a very hot, illuminated region. When a dust-gas cloud surrounding a protostar falls in, we deal with accretion which is the agglomeration of matter on a star. Frequently, the so-called accretion shock is observed and temperature significantly rises in the place where the matter has fallen. Due to rotation and accretion processes, in the presence of magnetic field, a certain portion of matter is cast out to space again, in the form of molecular outflows. The outflow of matter and its interaction with the dusty and gaseous envelope creates shock waves, in which a sharp rise in temperature and density occurs. Then, UV photons can be produced.
According to the team, these molecular outflows are the source of the UV radiation observed in a star-forming cloud in the Serpent constellation. The study shows that HCN and CN molecules are good indicators of UV radiation, and in the studied star-forming region the dominant reaction that destroys HCN molecules is their reaction with UV photons. Simultaneously, CN molecules are more resistant to photodissociation. This means that the same photon that destroys HCN usually does not destroy CN – in the case of the latter molecule, even more energetic UV radiation is needed.
Contact
|
mgr Agnieszka Mirocha Astronomical Observatory A.Mirocha [at] oa.uj.edu.pl |
Original publication
Agnieszka Mirocha, Agata Karska, Marcin Gronowski, Lars E. Kristensen, Łukasz Tychoniec, Daniel Harsono, Miguel Figueira, Marcin Gładkowski, Michał Żółtowski, Signatures of UV radiation in low-mass protostars I. Origin of HCN and CN emission in the Serpens Main region, A&A 656, A146 (2021).
The research was conducted at the Department of Stellar and Extragalactic Astronomy of the Jagiellonian University’s Astronomical Observatory (OAUJ). The research was funded by the National Science Centre (grant NCN 2016/21/D/ST9/01098) and by the Foundation for Polish Science (grant First TEAM No. POIR.04.04.00-00-5D21/18-00).
A sample of 44 blazar candidates behind the Magellanic Clouds, including 27 flat spectrum radio quasars (FSRQs) and 17 BL Lacertae–type objects (BL Lacs), were selected and described by Żywucka et al. (2018). All objects in the sample were selected based on their radio, mid-infrared, and optical properties. Now, the analysis of the blazar candidates is extended with modelling of optical light curves provided by the Optical Gravitational Lensing Experiment (OGLE).
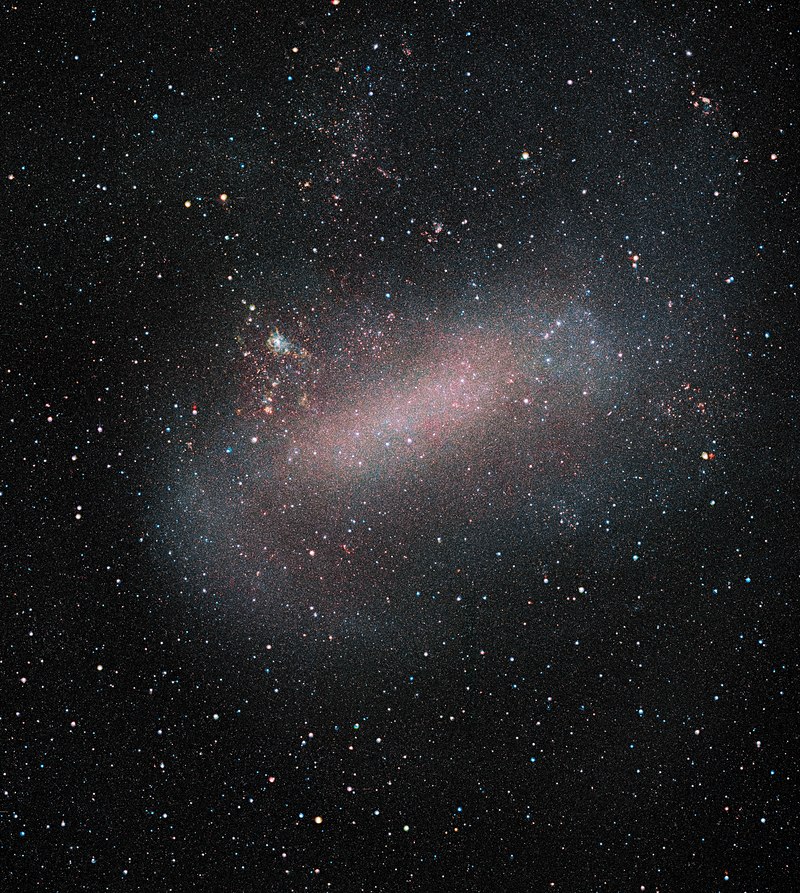
Illustration 1: Large Magellanic Cloud, one of our nearest galactic neighbours. Credit: ESO/VMC Survey.
All objects used in the study were selected from the long-term, deep optical monitoring survey, therefore they constitute a sample of faint sources with irregularly sampled optical light curves (LCs). The team investigated them to determine variability-based classification of the blazar candidates and to analyse their long-term behaviour.
The LCs were analysed with the Lomb-Scargle periodogram to generate a power spectral density for unevenly sampled time series. Alternatively, the team used the Hurst exponent to measure the statistical self similarity of a time series, and the A-T plane, to quantify the smoothness of time series by comparing the sum of the squared differences between two subsequent measurements with the standard deviation of the time series. These methods were applied to look for the blazar-like characteristic features and to study the long-term behavior of the optical fluxes.
Illustration 2 shows that the flat spectrum radio quasars (or just FSRQs) are characterized by lower values of the Abbe value, A, on the A-T plane than BL Lacs. These two classes of blazars are clearly separated on the A-T plane. This finding shows that the flux changes are different for the two blazar classes, thus they should be driven by different physical mechanisms or take place in different blazar components. The separation allowed distinguishing blazar classes based on light curves only, without including multiwavelength, polarimetric, and spectroscopic properties. Furthermore, the location in the A-T plane indicates properties in the structure of LCs which are not revealed by other methods used in this work.
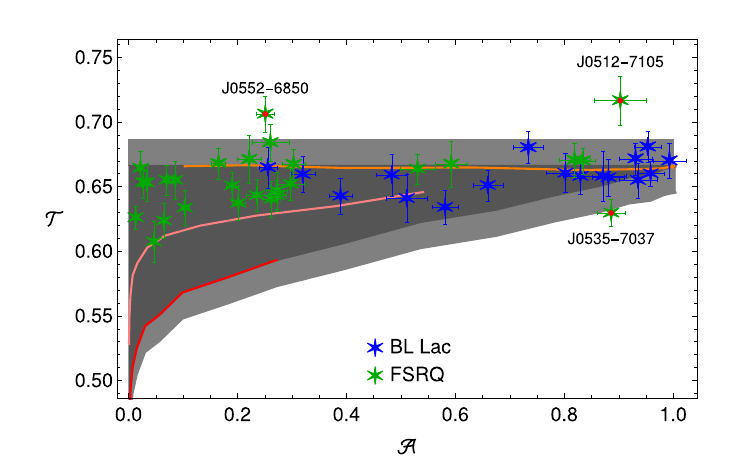 Illustration 2: Locations of the blazar candidates in the A-T plane. The dark grey area is the region between the pure PL line and T=2/3, while the light gray regions correspond to the error bars of the simulations. FSRQs (marked by green stars) are well separated from BL Lacs (blue stars). Credit: The Authors.
Contact
|
Dr Natalia Żywucka-Hejzner Centre for Space Research N.Zywucka [at] oa.uj.edu.pl
Dr Mariusz Tarnopolski Astronomical Observatory Mariusz.Tarnopolski [at] uj.edu.pl
|
Original publication
Optical Variability Modeling of Newly Identified Blazar Candidates behind Magellanic Clouds, Astrophysical Journal, 888, 107, 2020 is the result of collaboration between the Centre for Space Research of the North-West University and the Astronomical Observatory of the Jagiellonian University (Natalia Żywucka–Hejzner, Mariusz Tarnopolski, Markus Böttcher, Łukasz Stawarz, Volodymyr Marchenko).
The research was conducted at the Department of Stellar and Extragalactic Astronomy and Department of High Energy Astrophysics of the Jagiellonian University’s Astronomical Observatory (OAUJ).