
Multi-wavelength diagnostics of the Molecular Cloud, DC 314.8-5.1
An international team of astronomers led by researchers at the Jagiellonian University Astronomical Observatory, study the multi-wavelength characteristics of the interstellar medium, probing the stellar populations within the dark cloud, DC 314.8-5.1. The team utilized data from the Gaia optical, 2MASS near-infrared, and WISE mid-infrared surveys, dedicated imaging with the Spitzer Space Telescope, and X-ray data obtained with the Swift-XRT Telescope (XRT).
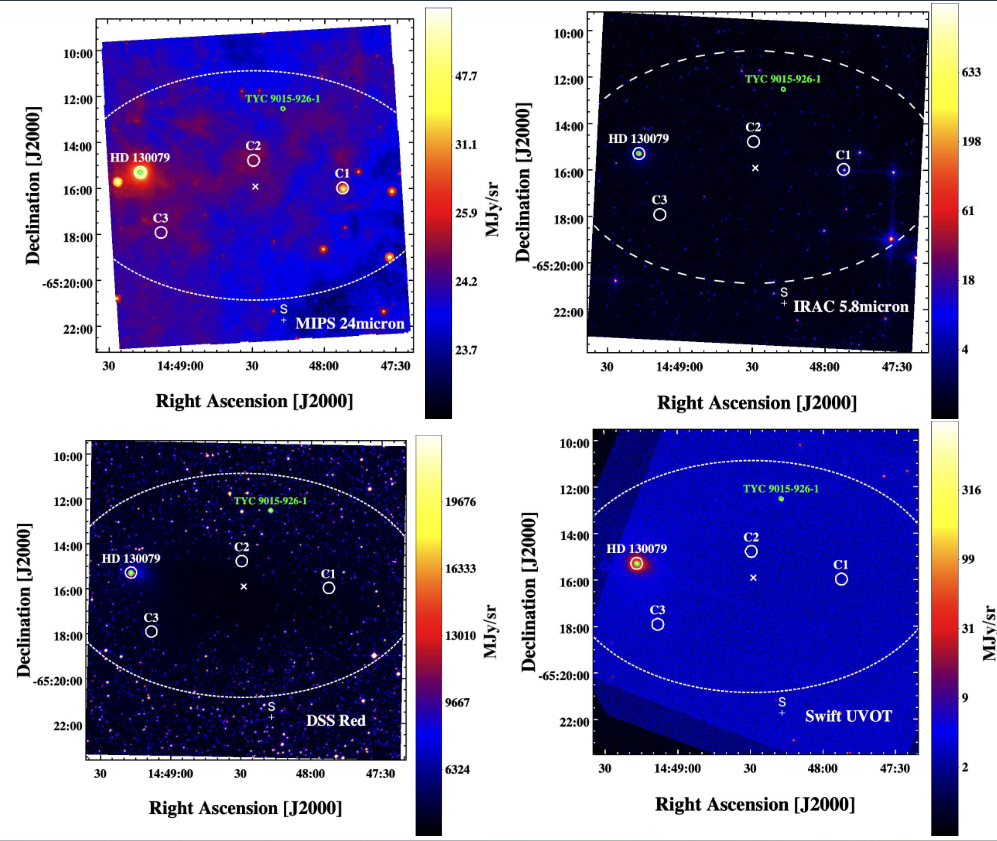
It follows that there in studying clouds prior to the onset of star formation, to study the conditions there. Through the use of multi-wavelength observations, we can probe the conditions in such clouds, as seen in Figure 1. Using observations in optical bands (bottom-left panel) shows the absorption of stellar light by the dust, in infrared we can begin to see the stars hidden behind the cloud (top-right), and even see the emission of the dust itself (top-left), additionally we can see nearby objects using UV observations (bottom-left).
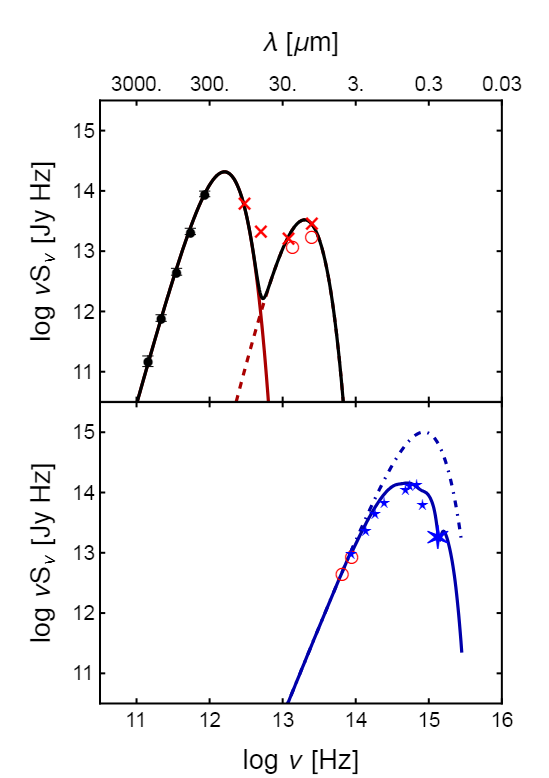
Each wavelength can show different aspects of the system with mid to far infrared observations showing dust emission with cooler dust becoming more prevalent with millimeter observations. Using broadband observations one can inspect the temperature profile of a molecular cloud as seen in Figure 2.
In this research we further discuss the multi-wavelength properties of the dark globule, DC 314.8-5.1, through dedicated observations with the Spitzer Space Telescope and the Swift-XRT and UVOT instruments, supplemented by the archival Planck, IRAS, WISE, 2MASS, and Gaia data. We identified it as an ideal candidate for deeper observations, particularly in high-energy X-ray and gamma-ray.
Original publication
E. Kosmaczewski, Ł. Stawarz et al. “Multiwavelength Study of Dark Globule DC 314.8-5.1: Point Source Identification and Diffuse Emission Characterization”. In: ApJ 959.1 (Dec. 2023), p. 37, DOI 10.3847/1538-4357/ad077a. arXiv: 2209.02372 [astro-ph.GA].
The findings described are part of a study conducted in the Department of High Energy Astrophysics of the Jagiellonian University Astronomical Observatory in Kraków.
Contact
Łukasz Stawarz
Astronomical Observatory
Jagiellonian University
L.Stawarz [@] uj.edu.pl
Classification of galactic mergers with convolutional neural networks
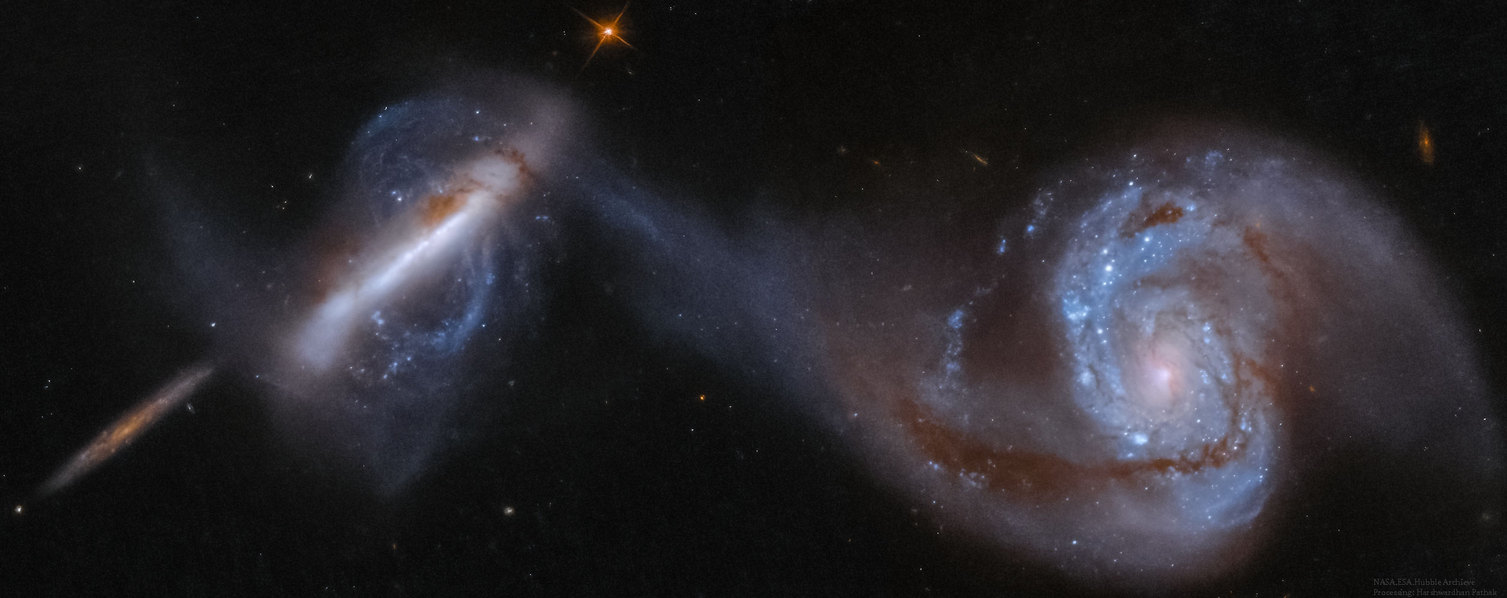
Lambda-CDM cosmology assumes that galaxies form by hierarchical mergers of smaller structures, so mergers of galaxies provide astronomers with crucial information about the evolution of galaxies over time.
When the mass of one of the galaxies involved in a collision is significantly greater than that of the other galaxy, the merger process is smoother, and the smaller galaxy is usually absorbed by the larger one, leaving it almost untouched. Galaxy mergers are a significant factor in the study of the evolution of the Universe. It is estimated that mergers account for less than 10% of low redshift galaxies, with the percentage rising to 20% for those in the range of 2 to 3.
A major challenge in the study of galaxy collisions is detecting them with sufficient efficiency and completeness. Due to the wide range of morphological features of galaxy collisions, their visual classification is difficult in terms of consistent, reproducible application. The use of morphological parameters provides a way to determine morphology in a reliable and invariant way. They describe the shapes and concentration of light in the images. However, obtaining these parameters requires images with sufficiently high resolution. Another method - so-called close pairs - is more direct. It involves finding pairs of galaxies that are close together in the sky and at the same redshift. However, it requires expensive, long-term spectroscopic observations.
The result challenges the previous knowledge of pulsars. The traditional scheme, according to which particles are accelerated along magnetic field lines inside or slightly outside the magnetosphere, cannot explain the new observations well. We may be observing particle acceleration through a so-called magnetic reconnection process outside the light cylinder that somehow preserves the rotation pattern, but even this scenario faces difficulties in explaining how radiation of such extreme energy is produced.
With the upcoming new sky surveys providing astronomers with large amounts of data, including Euclid and LSST, it will be crucial to create algorithms to automate time-consuming and repetitive tasks, specifically such as identifying galaxy mergers. Recent studies have shown that it is possible to use convolutional neural networks (CNNs) to solve the problem of visual classification of galaxy mergers.
A recent comparative study of machine learning-based galaxy collision detection methods by an international team of astronomers aims to understand the relative performance of different machine learning methods within the same system (Margalef-Bentabol 2024 et al.). A total of six machine learning methods were tested, based on the same cosmological, gravomagnetohydrodynamic IllustrisTNG simulations. These allowed the generation of images that mimicked the real data. All of the grids that have not been pre-trained on galaxy images yield similar results, despite being built on different architectures. This may indicate that preprocessing the training data is a more important factor than choosing the parameters of the neural networks.
This aspect is now also being studied by astronomers from Jagiellonian University Astronomical Observatory, testing and comparing the performance of convolutional networks trained on original and processed data. They match Sersic profiles - the dependence of light intensity on distance from the galactic center - to synthetic images of galaxies, and then subtract them from the original ones. This process creates so-called residual images, where anything that doesn't fit the matched profile remains. This allows subtle features of galactic mergers, such as diffusion structures or tidal features, to be highlighted. As a result, it is possible to train three different networks with the same architecture on three different data sets - the original images, the fitted Sersic models and the residual images.
The results show that the network trained on the original data performs best. Its overall accuracy - the number of correctly classified images - is 74%. The network performs better at identifying non-colliding galaxies. 82% of them are correctly identified, while for colliding galaxies this number drops to 64%. The network trained on the Sersic models has similar performance in recognizing non-mergers: 80% of them are correctly classified. In contrast, it performs much worse at identifying mergers, correctly predicting only 56% of them. The network trained on residual images shows different characteristics - it correctly classifies 67% of images showing intact galaxies and 66% of images of colliding galaxies, making it the most effective network in correctly classifying mergers. The last two networks in general have similar accuracy, classifying correctly about 69% of all images.
By applying machine learning methods, it was possible to determine that the classification of galaxies into mergers and non-mergers is possible using both the weak diffusion structures present in the residual images and the spatial information contained in the Sersic profiles. The next step will be to adapt networks trained on synthetic images to real astronomical data, as it turns out that networks trained on simulation inputs perform much worse in evaluating real images. Techniques that focus, among other things, on finding common features in the domain of the images used for training and evaluation appear to be key in this aspect.
Original publication: in preparation.
The findings described are part of a study conducted in the Department of Stellar and Extragalactic Astronomy of the Jagiellonian University Astronomical Observatory in Kraków.
Dawid Chudy
Astronomical Observatory
Jagiellonian University
Dawid.Chudy [@] doctoral.uj.edu.pl
Pulsar and gamma rays with record energy
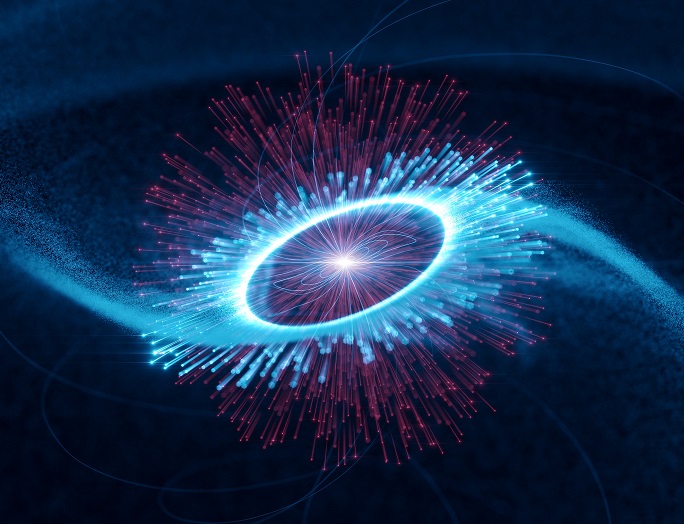
Pulsars are fast-rotating neutron stars endowed with very strong magnetic fields. Although it has been more than 55 years since their discovery, the mechanism responsible for their radiation is still mysterious.
Pulsars are the left-over corpses of stars that spectacularly exploded in a supernova. The explosions leave behind a tiny, dead star with a diameter of just some 20 kilometres, rotating extremely fast and endowed with an enormous magnetic field. Such a star is made up almost entirely of neurons and is also extremely dense: a teaspoon of its matter has a mass of more than five billion tons, or roughly 900 times the mass of the Great Pyramid of Giza.
Pulsars also emit rotating beams of electromagnetic radiation. They can be compared to cosmic lighthouses. If their beam sweeps across our solar system, we see flashes of radiation at regular time intervals. These flashes, also called pulses of radiation, can be searched for in different energy bands of the electromagnetic spectrum. Their source is probably the fast electrons created and accelerated in the pulsar's magnetosphere as it travels toward its periphery. The magnetosphere is made up of plasma and electromagnetic fields that surround and co-rotate with the star. Heading outward from it, the electrons gain energy and then release it in the form of observed regular beams of radiation.
The Vela pulsar (PSR J0835-4510) located in the Southern sky in the constellation Vela is the brightest pulsar in the radio band of the electromagnetic spectrum and the brightest persistent source of cosmic gamma rays in the gigaelectronvolts (GeV) range. It rotates about eleven times per second. Above few GeV, however, its radiation ends abruptly. Scientists assume that the electrons reach the end of the pulsar’s magnetosphere and escape from it. Using long-term observations with the H.E.S.S. telescopes, a new radiation component at even higher energies has been discovered, with energies of up to tens of teraelectronvolts (TeV). This very high-energy component appears at the same phase intervals as the one observed in the GeV range. To attain these energies, the electrons might have to travel even farther than the magnetosphere, yet the rotational emission pattern needs to remain intact.
The result challenges the previous knowledge of pulsars. The traditional scheme, according to which particles are accelerated along magnetic field lines inside or slightly outside the magnetosphere, cannot explain the new observations well. We may be observing particle acceleration through a so-called magnetic reconnection process outside the light cylinder that somehow preserves the rotation pattern, but even this scenario faces difficulties in explaining how radiation of such extreme energy is produced.
The Vela pulsar, apart from its other superlatives, holds the record as the pulsar with the highest-energy gamma rays discovered to date.
Original publication
The H.E.S.S. collaboration, Discovery of a Radiation Component from the Vela Pulsar Reaching 20 Teraelectronvolts, Nature Astronomy (2023).
The findings described are part of a study conducted in the Department of High Energy Astrophysics of the Jagiellonian University Astronomical Observatory in Kraków. The participation of Polish scientists in the H.E.S.S. project was co-financed from the program of the Minister of Education and Science "Support for participation of Polish scientific teams in international research infrastructure projects" under agreement no. 2021/WK/06.
Contact
Łukasz Stawarz
Astronomical Observatory
Jagiellonian University
Łukasz.Stawarz [@] uj.edu.pl
PSR B0809+74 – a drifting subpulse pulsar reveals the secrets of the emission mechanism
Pulsars are fast-rotating neutron stars endowed with a very strong magnetic field. While more than 55 years have passed since their discovery, the mechanism responsible for their radiation still remains mysterious.
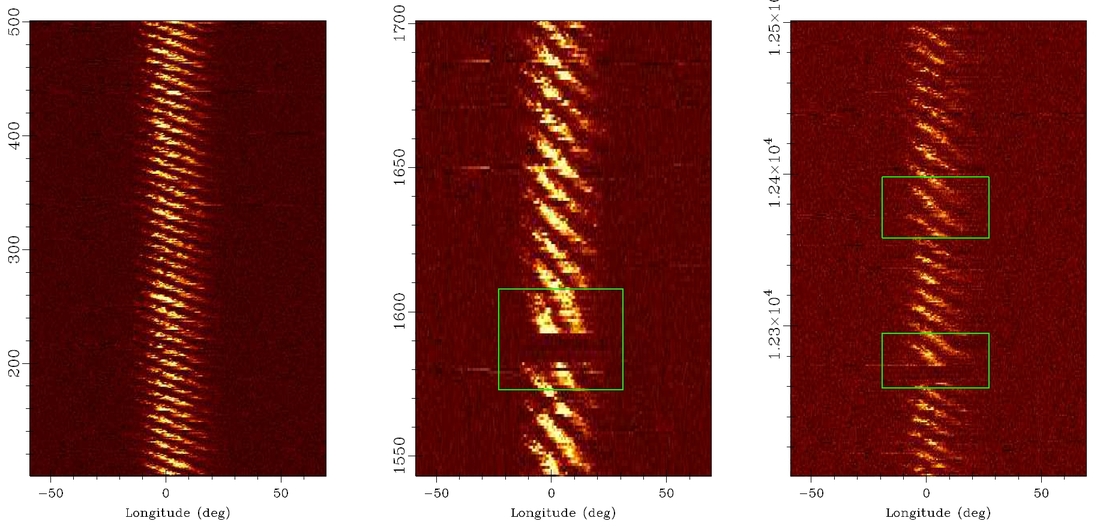
We know that radiate electrons accelerated along twisted magnetic field lines, which, along with the z pulsar rotation creates a "lighthouse" effect, but the details of the mechanism of radio emission formation remain largely unknown. One way to study this mechanism are observations of single pulses coming from pulsars, in which the phenomenon of "drifting pulses" is sometimes seen: with each successive pulse, the emission clearly shifts in phase, which is best visible in images of a series of pulses, revealing characteristic "drift bands".
Some pulsars also show other effects related to the emission mechanism, such as pulse nulling and radiation mode changes (moding). One such object is PSR B0809+74, which is regularly observed by a radio telescope belonging to the Jagiellonian University and being part of the pan-European LOFAR network in Łazy near Kraków. Observations of such objects are a key element in our attempts to understand the physical conditions in the magnetosphere of pulsars and the phenomena occurring there that lead to their radio emissions.
Original publication
Rahul Basu, Wojciech Lewandowski, Jarosław Kijak, Bartosz Śmierciak, Marian Soida, Leszek Błaszkiewicz, Andrzej Krankowski, Single pulse emission from PSR B0809+74 at 150 MHz using Polish LOFAR station, Monthly Notices of the Royal Astronomical Society, Vol 526, Issue 1, pp.691-699 (2023).
The publication was prepared as part of the POLFAR consortium (Polish consortium of the LOFAR network), with the participation of the Prof. Janusz Gil Institute of Astronomy at the University of Zielona Góra, the Astronomical Observatory of the Jagiellonian University in Kraków, and the Space Environment Radio Diagnostics Center belonging to the University of Warmia and Mazury in Olsztyn. The work received funding from NCN grant no. 2020/37/B/ST9/02215. Polish participation in the activities of the LOFAR network is funded by the Ministry of Science and Higher Education (LOFAR2. 0 upgrade, decision number: 2021/WK/2), which also funds the maintenance of the LOFAR PL-610 Borówiec, LOFAR PL-611 Łazy, and LOFAR PL-612 Bałdy radio telescopes (decisions nos. 30/530252/SPUB/SP/2022, 29/530358/SPUB/SP/2022, and 28/530020/SPUB/SP/2022).
Marian Soida
Astronomical Observatory
Jagiellonian University
Marian.Soida [@] uj.edu.pl